Eth is gonna take a little rest little volume in the levels above $2834
Change in tendency in the Stoch, marking selling signal
(not here) red marks in the 4hrs and 3 hrs timeframe in Market Cipher B
9 continuous green candles, bulls run out of gas
a little change in momentum, ETH will rest for a couple of days and accumulate volume in this levels
Marketcipher

VECHAIN soon to breakout for May 202121 EMA is awake now since it has been dead for 2 weeks.
Money flow keep coming out, making selling power stronger than buying power. However, price action is still increasing. Looks like big whales are slowly selling their shares at a rate that small fishes barely matching up to it.
Surprisingly, momentum wave is still not crossing down.
Momentum wave keeps crossing up to 0-100, instead of crossing down to 0 - (-100) for good buy entry.
Basic bullish pennant triangle spotted, price entry from ATH and most recent low are used as reference points.
Fibbonachi retracements. Price entry between 0.2 to 0.3 fib retracement levels.
Price Entry Long: 0.20669
Profit Target 1: 0.22075
Profit Target 2: 0.26257
Profit Target 3: 0.27663
Stop Loss 1: 0.19263
Stop Loss 2: 0.24851
BY this week (3rd - 10 th May 2021), we will see a breakout.

Bitcoin Near Term Price - Wyckoff + Fib + Momentum AnalysisThe first-attempt Wyckoff distribution schematic seen on this chart is a popular one floating around at the moment. I've included fib extensions that are very well respected as a way to help guide target price points along the way. We may not drop as low as the 3.618, maybe 4.618, but I definitely believe we are down a bit before seeing a new all-time high. The momentum waves on this daily chart feature strong anchor waves and as soon as this upward action on the daily concludes, it will likely reveal rsi divergence which is what even higher timeframes are illustrating.
I'm expecting to see upward price movement towards the the x.618 fib, identified with the first LPSY -- 56kish -- and then begin a more pointed downtrend price movement.
Near-term bullish, short-term bearish. Once we finally do bounce, based on a very similar pattern in previous bull runs, it will be a very inspiring bounce.

$STBU looking bearish. Continuation from my previous TA on $STBU. Link here:
4 Hour chart between 14th March 2021 and 26th April 2021 (today).
Main resistance and support lines:
• Resistance 3: 0.3329
• Resistance 2: 0.2646
• Resistance 1: 0.0208
• Support 1: 0.1689
Divergence 1 of momentum wave. Below are the confirmation signals:
• Even though 21 period EMA was blue and looking positive, there is a false signal.
• Bearish downtrend 14th – 17th March 2021 (refer to yellow circle) even when there are green dots printed between 12-16th March 2021 for uptrend.
• RSI was between 91 – 71, meaning on overbought level.
• This means bag holders have been looking for an opportunity to dump even when there are new investors coming in.
• Money flow was in between red and green so selling pressure and buying pressure were indecisive.
• Big red dot above overbought area where selling had good profits for those bag holders looking for an opportunity to dump.
Divergence 2 of momentum wave. Below are the confirmation signals:
• 21 period EMA is not blue, dynamic resistance line adds bearish signal.
• Bearish downtrend (refer to yellow circle) even when there are green dots printed between 20th – 25th April 2021 for uptrend. Why? Because momentum wave is still down trend, never print green dots consecutively towards uptrend.
• Money flow has been red since 25th March 2021 and today is 26th April 2021 which means selling pressure has been higher than buying pressure for 1 month until now.
• Big green dot below oversold area = could be one of the best buys in the history of STBU since the last big green dot printed was on 6th March 2021. That is 50 days ago.
Price Projections?
• Fib resistance fans on the most recent low which was on the 20th April 2021 are used for price projections. As of referenced to 26th April 2021 00:00 GMT 8+:
Bullish:
• 29th April 2021: 0.2093360193 - 29% increase
• 5th May 2021: 0.2681028994 – 65% increase
Bearish:
• 29th April 2021: 0.0989469201 – 16% decrease
• 5th May 2021: 0.0696645098 – 57% decrease
Fundamental analysis updates:
$20-30 million offering DIDN'T increase price action at all.
Stobox CEO mentions Tier 1 Exchange Listing within April 2021 which means 5 days left. If price action reaches 0.010 within 5 more days , I will sell these.


Eth Continuation Pump?Momentum waves on Market Cipher suggest this could continue. Hoping btc plays nice and we ride this baby some more. (THE 12 MINUTE SHOWS A CLEARER BOUNCE OFF RECENT DIP)

Filecoin Great Buy Opportunity, First IdeaIndicators show that FIL will perform great on April
great opportunity for long

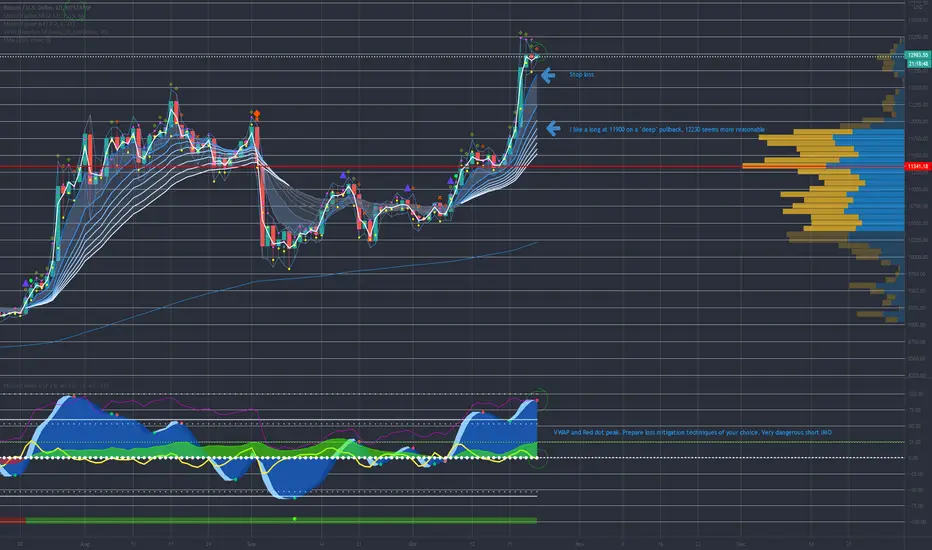
Bitcoin: Quick Dip And Then A Pump?Daily Bitcoin analysis
Red dot on the 1D, but that might not be a big deal. Let's see what Bitcoin wants to do short-term. VWAP momo crossing to the upside, Wolfpack in the green curving slightly up. We bounced right off the 21D MA again, establishing it as a support so far. Technically right under the previous channel trend line, but maybe we're just working our way back above it. If we can establish above this trend line again that would be bullish af IMO. Right now I'm okay with where we are. The rd does not bother me much.
4H we've got good signs in my opinion. Green dot with Momentum stabilizing up. Got a pump last night with the VWAP cross to the upside. MF still looking good. WP in the green. Everything's not perfect, but it doesn't seem bearish to me at all short-term. We are right underneath the daily trend line that has given us reactions before, but as long as you're not trying to long the house right HERE, you should be alright. Take and secure profits along the way.
We dumped on the 3rd all the way down to 56500 area, pumped the 4th but only didn't make it all the way back up, only to 58500, then dumped, but only to 56800 area, making a higher low. Then we pumped already past the high from yesterday, making a higher high. Short-term bullish IMO and longer-term if we can break the 59500 level next.
Short-term bullish, but 1H on MC kind of looks like it's topped for a bit and wants to retrace, which is beautiful for buying the dip for an entry. If we just use the standard fib retracement levels for the low to high from last night, we could put orders in just above the 0.236, 0.382, and 0.5, and that's exactly what I did. Maybe we fall to the 1H EMA ribbon? Maybe we only go 3/4? But bullish for now. Might be a scalp and we get rejected at the orange line again, maybe we run.
24m shows me the same thing, a dip and then a pump.
If you want to use the best indicator package in the world, which I am using right here, then you need to get Market Cipher. Use the link below to get a 10% discount.
marketciphertrading.com

$BEPRO just breakdown. Can it go up before projected targets?About BEPRO
The code base for Gaming 3.0
• We are a Code-as-a-Service protocol providing technology and support for blockchain-based applications.
All Networks
• Build on Ethereum, Polkadot or Binance Chain with existing infrastructure
Robust Libraries
• Our libraries and Smart Contracts were audited by Red4Sec, Certik & ITechLabs
Decentralized
• Our Technology was created to be 100% decentralized, access it in our github
Build Anything
• Prediction Markets, P2P Betting, Informational Markets, DeFi Gaming, and more
Change Fast & Be Scalable
• Use, Fork, Edit and Run it yourself.
• Software made with the goal of being editable every day of the year
Trend-based fibbonachi pattern point references (The WHAT):
1st Low: 25th March 2021 – 0.01880000
1st High: 2nd April 2021 – 0.02977920 (58.4 % increase in 7 days)
2nd Low (after a straight breakdown) – 0.02011000 (-32.29% decrease in 2 days)
Market Cipher (The HOW):
Market Cipher is used for giving confirmation signals.
VMC Cipher A:
Yellow circle it’s where price action hits main support / resistance line from 17th March to 4th April.
No blue triangle (reversal sign) of VMC Cipher A printed to indicate reversal.
VMC Cipher B:
Momentum wave is currently at the bottom with a green dot at -61. Aim for -20, then 0.
Green dots printed on the 0 must be printed AFTER blue triangle (reversal sign) of VMC Cipher A prints.
Money flow bar is red, indicating selling pressure is higher than buying pressure.
WolfPack ID:
Wolf Pack ID not yet cross >0. Must be sync with green dots.
to 20 then to 40 then to 60 and sell!
Forecast Targets as referenced from 4th April 2021 8:24pm (UTC +8) at current price of 0.02080022:
15th April 2021: 0.02326448
21st April 2021: 0.02469192
26th April 2021: 0.02623631
7th May 2021: 0.02940743
Annoyingly, bears (shorting this coin) are winning over bulls (longing this coin) on the weekend which BTC is not rising. This should be up.
Let’s keep monitoring signals from VMC Cipher A, B & wolfpack ID.

Market Cipher B - Large Consolidation Pattern - 90k-100k soon???When you technically analyze a chart you are analyzing for 3 things:
-Support
-Resistance
-Consolidation Patterns
Support & Resistance are meaningless without Consolidation Patterns. If you cannot utilize nor recognize consolidation patterns then knowing the Support & Resistance will not help you to know when to enter a trade. Entering a trade is the key component of trading. Being able to predict price ceilings and price floors is great, but if you never have the an understanding of when to enter a trade then you will never be able to take advantage of the profit that can be made from these price ceilings and floors.
This BTC pattern that I have stumbled across via Market Cipher B looks to be a massive Bullish consolidation pattern that could see us moving to 90k/100k in a matter of days or day when the breakout comes. How breakout patterns work is whatever trend has the last word is the direction we will be going. For example, if we have an equilateral triangle and the trend is upwards then that means we will be breaking out in a Bullish trend. With that being said from what I am seeing in the patterns that are being formed in Market Cipher B it looks as if the Bulls will be getting the last word based on the timeline that was set forth. Reasoning behind this idea is that the longest holding patterns tell you the general trend. If you are having higher highs & higher lows then you are in a Bullish Trend, if you are having lower highs and lower lows then you are in a Bearish Trend. As almost all know we are currently in a Bullish Trend overall, but major consolidation patterns can mean major reversals in a pattern or major extensions of a pattern. As you can see in the chart when the money flow is turning green (Buying) it is staying green for a longer average period of time than when red (Selling), Higher highs & Lower lows. The timeline is also leading me to think that the money flow will being reaching its shortest period in the red before the shortest green period, AKA: Picking up more fuel before a big upward run or blowing of some steam before the big upward run.
Lastly, the reason why I believe this could be the consolidation period that leads BTC to directly 90k/100k is because of how large the money swings have been. The larger the swings from top to bottom during a consolidation period the larger the breakout move will be. This consolidation period has created about a ~15k-20k gap from top to bottom. Now for those individuals leading this consolidation period (Whales) it would not make sense to pump the price to anything less than double the bottom that they bought at (~42k-43k), which would mean 84k-86k minimum. Now with that being said, a consolidation period works differently for Whales than it does the rest of us. Where we worry about selling low and buying high, AKA: Profit. Whales worry about quantity, so they dump the price all the way down to 42k/43k by pushing the price downward with buy/sell walls as well as selling large amounts quickly which push people to panic sell which then pushes the price down even more without the Whale even needing to do anything. Once the price is down at the floor that the whale wishes to hold it at they begin to buy once again, but this time is lower volume over a longer period of time so that they can grab as much as possible during this period. Once selling volume decreases to a level where the Whale can no longer buy larger amounts this is when the Whale will push the price back up in the same manner as it was pushed down. The Whale will rinse and repeat the process multiple times until they have enough BTC to lead a large BTC pump or dump depending on the money movement direction that will make the Whale the most money. Now, logically speaking in the long term that will always be to end in a Bullish Trend rather than start a huge Bearish Trend. If these Whales hoard wealth in BTC then the ultimate goal would always be to continue the long term upward trajectory of BTCs price. Now the key to the consolidation period of a pump is to take away enough hope from the masses during the dumps that they continue to sell once the Whale has reached the price floor. Now doing this is a fine balance where you cannot make the masses lose all hope or the Whales would end up being left with the bag and no buyers because BTC would be seen as a scam. Now, since Whale manipulation is clear we must realize that the Whale is consolidating as much bitcoin as possible during the period trying to buy as low as possible without fully discouraging the public. This means that if we average where the Whale is currently buying, between 42k & 62k, then we would see that the Whale average buy if he is Dollar Cost Averaged throughout the consolidation period would be ~52k. So if we double 52k we get 104k, hence my conservative prediction of 90k-100k.
Hoping to see this patter place out soon, let me know what you think.
Also, this is not financial advice it is simply my opinion on the financial climate of BTC at the moment.

ETHUSDT $1888 within 48 hours VISA moves to allow payment settlements using $USDC.
Its circulating supply and exchange holdings keep renewing at an all-time high every day.
Currently, $USDC is the second-largest stable coin after $USDT.
$ETH network might be used for Visa payment settlements under the brand name $USDC.
Im expecting massive accumulation on $ETH
Check my profile BIO

BTC Short-drop before big push upLooks like BTC will have a short dip at bottom of 2021 channel support/resistance before hitting a major intersection of multiple lines of support and bouncing up.
MarketCipher 6h green dot (buy signal) has also been activated so there's a good chance, we've already bounced off the bottom of this dip.
Big limit buy at $51,800
Of course, always possible for BTC to break support and drop to $50,000 but I think we have enough support and broken enough resistance lines for the breakout to start.

Bitcoin chart about to print 6hr dotAs stated before the 6 hour dot is extremely bullish and the last time 2 6 hour LARGE GREEN DOTS were printed this close together was after the Bitcoin market bottomed out in MARCH of 2020.. BE AWARE this dot has about 3 1/2 to confirm. IF IT DOES WE HAVE A 90% of COMPLETE MOONAGE!

Careful of slight dip down within next few hoursAn inverse head and shoulders pattern on 30 minute timeframe was forming until a break in pattern above the neckline. Could still dip back down to the shoulder $56kish before a shot upward, to finish out the cup and handle patterns forming on the 4 hour and daily.
Market Cipher free version isn’t as robust as the paid, but typically following the trend waves and MFI line shows a pretty good picture. The waves aren’t quite strong enough to confirm the straight shot up breaking the inverse H&S forming.
Overall, opening a long below $58k and closer to $57k isn’t too bad of a bet.

MANA Buying Opportunity - Wave Trend Fibonacci 50% Retracement Buying Zone 0.82 - 0.90.
MANA has a lot of potential for 2021.

One possible scenario: Updated
IF this trend continues, I'm looking to take profits and an entry point to short in the red zone starting March 21. Last Sunday in Feb saw retracement prior to last Friday of month futures mature. March 26 is last Friday of month and quarter when futures mature.

Neion Algo Revisedokay now , this looks like a mess ... although i enjoy it. i started with less.. although i think this is all i will add. it seems to cover everything i need. lot of these can be misleading although if you know when to enter at the rest of them can keep you calm through a storm while scanning through all the time frames. i would not recommend someone just starting out to use this as it is very complicated yet simple at same time they may get a bad entry. pro traders only. personally i like comparing AS MANY buy / sell indicators as POSSIBLE. then in my mind i can work out what is best after scanning every time frame. let the computer think for me. there is also an indicator for every type of candle pattern. which helps a lot if you know them. 2 different support / resistance indicators one coming off the candles and other to show major points which also keeps me calm. much love hope i gave people some ideas.


BTCUSD Near Term (3H-4D) Analysis for March 1st 2021Analysis of the charts from 4D to 3H giving us an idea of what to expect from BTCUSD over the next couple of days.
This is not financial advice, merely the musings of a munted minstrel.

XMRUSDT - BINANCE FUTURES - To get Access Free DM me BINANCE:XMRUSDTPERP 4H to 1H all turns bearish. Good to Short XMR based on the one hour divergence
The Fury A and B indicators are free and to get the access you to trade under my refferal in any one of the following exchange
Binance Furures Code : Cashback10
Bybit : (Link DM me )
Phemex : ( Link DM me )

LINK/USD BROKEN RESISTANCE MARKET CIPHERStrong Buy signal on the daily, flirting with the golden pocket line, money Flow (red area) flipping green, not much ahead of the VPVR in terms of resistance. We are very close to our next resistance point around $13.2 with little above that for parabolic moves. Feeling very bullish depending on how btc moves gradually or stagnates. Very strong play from above $12.5 this morning congratulations to all that took a long there. Plenty of room to move on daily, two day, three day, and just getting started on the weekly. Heiken Ashi candles as always.
Strong hands!
-Cryptocontortionist

BTCUSD Market Cipher Daily Sell signalLooking at a quick cool of or pull back, VWAP closed under Zero, Sell signal on Daily Momentum oscillator. 3 Day shows there could still be room to the upside but ultimately price always comes back for the ema's. prepare with stops, conditional rebuys, leveraged longs, or just hodl. We are due for something cool atm, this should be short and quick.
Range Forming of about $500Looks like we are leveling off in a range and could see a bump up before any bigger moves in either direction.
Top of range would be around the $9200 mark, in line with a previous trendline support.
