BITCOIN DUMP TO $87,000?!According to my ‘Elliott Wave Theory’ strategy, BTC has now competed its 5 Wave Impulse run OR is very close to completion!
Is it time for price to start correcting and dump down towards $87,000?
Let me know in the comments what you think.
Marketcrash

MAGS SUPER STRUCTURE FORMING CAUTION!We have MEGA superstructures forming everywhere. H&S Eiffel Towers, etc.. None will be more devastating to 401ks and people's portfolios than the MAGS breaking down from this mammoth structure.
Last chance to GTFO forming.
CAUTION is in order!
Click Boost, Follow, Subscribe. Let's get to 5,000 followers ))

Mastering Volatile Markets: Why the Trend is Your Best Friend█ Mastering Volatile Markets Part 4: Why the Trend is Your Best Friend
In Part 1 , we covered reducing position size.
In Part 2 , we explored liquidity and execution strategies.
In Part 3 , we discussed the power of patience over FOMO.
Now,we're diving into one of the most important principles of all — especially in volatile, fast-moving markets: Follow the Trend. Trust the Trend. Trade With the Trend.
In wild markets like these, everything changes quickly. Indicators print overbought or oversold conditions well before the market even thinks about reversing.
Divergences can keep stacking up while the price continues trending for another 300, 500, or even 1000 points. Why? Volatility + Liquidity conditions = Extended trending behavior.
When liquidity is thin, and volatility is high, strong trends tend to last longer than usual:
Breakouts run further.
Breakdowns fall deeper.
And counter-trend trades? They're often a fast ticket to losses.
█ What Pro Traders Know Better Than Anyone:
In volatile markets, trend-following isn't optional — it's survival.
But wait, it is obvious that trends aren't perfect straight lines. So how can one even realistically “follow” a trend, especially in volatile markets.
Well, the key is to expect the unexpected. Experienced traders trade logically, we expect pullbacks, fakeouts, stop hunts, snapbacks and/or channel breaks. In fact, we prepare for them.
It is detrimental to assume the trend is over just because of these moves. Most of these are liquidity traps, not real reversals.
█ Here's What Pro Traders Do Differently:
⚪ They Identify the Core Trend Direction
Pro traders use price structure, trendlines, moving averages, VWAP , or higher timeframe levels to identify the trend direction. Once identified, every trade respects the trend.
Let me explain with an example.
→ Uptrend Identification:
Say you notice that the price of Gold (XAUUSD) has been consistently making higher highs and higher lows. What should you do?
You use the 100-period moving average (MA) and see that price is staying above it, indicating an uptrend. You wait for price to pull back to the MA, giving you a low-risk entry to join the uptrend rather than chasing the trend.
→ Downtrend Identification:
In a downtrend, USD/JPY keeps making lower highs and lower lows. You observe the 100-period moving average pointing down. This is your cue to look for short entries , avoiding countertrend buys that could trap you.
⚪ They ONLY Look for Entries at Key Trend Channel Levels
Professional traders don’t chase the price or try to catch every move. Instead, they patiently wait for price to return to key areas within a well-defined trend channel , either the upper boundary (in a downtrend) or the lower boundary (in an uptrend).
→ In an uptrend:
Pro traders draw a trend channel based on the price move. When price pulls back to the lower boundary of the channel (often aligning with demand zones), they start looking for long entries, aiming to trade with the trend and target a new high.
→ In a downtrend:
The same logic applies, but in reverse. Price pulls back to the upper boundary of the channel (supply area), offering a clean short opportunity to continue with the trend and target a new low.
But here’s what separates pros from amateurs:
→ They expect fakeouts, spikes , and temporary breaks beyond the trend channel — especially in volatile conditions.
→ They don’t panic when the price briefly moves outside the channel. Instead, they wait for confirmation signals (like a rejection candle, break of structure, or momentum shift) before entering.
→ This gives them both a logical entry point and a favorable risk-reward setup — aligning with the larger trend direction while staying protected if the trend fails.
⚪ They Treat Countertrend Moves as Opportunities to Enter WITH the Trend
When a countertrend move happens, pro traders see it as an opportunity to enter with the prevailing trend, rather than trying to catch a reversal.
→ Counter-Trend Move in an Uptrend:
Let's say S&P 500 is in a strong uptrend, and it experiences a sharp pullback of 5%.
While many retail traders panic and try to short the market, pro traders see this as a buying opportunity at a lower price, anticipating the trend will continue after the correction.
→ Counter-Trend Move in a Downtrend:
For Gold (XAU/USD) , if the price falls sharply from $1,900 to $1,850 and then retraces back to $1,875 (a previous support-turned-resistance level), pros see this as an opportunity to sell into the trend rather than buying into what could be a false recovery.
⚪ They Accept That Trends Can Look "Overbought" or "Oversold" for a Long Time
In volatile, trending conditions, RSI can stay above 70 for hours or even days, and divergences can build for a long time without price reacting.
→ RSI Above 70 in an Uptrend:
Bitcoin (BTC/USD) rallies from $40,000 to $60,000. Despite RSI being above 70 for a few days, pro traders don't fight the trend because momentum is strong. Instead, they look for a pullback to the 100-period MA for a safer entry.
→ Divergence in Downtrend:
The EUR/USD shows a bearish trend , but the RSI starts to build a divergence as the price keeps making lower lows. Pro traders ignore the divergence because the trend is still strong. They wait for a clear break of the trendline or confirmation that price has reversed before considering a long trade.
█ Summary of Part 4 — Trend is Your Best Friend
You can't control how far a trend will run…but you can control whether you're with or fighting against it.
And trust me, fighting a strong trend in a volatile market is a battle retail traders rarely win.
Here’s what you should take away from this article:
Volatile markets = Extended trends
Indicators can lie — trend structure tells the truth
Fakeouts & pullbacks are normal
Don't fight the trend — trade with it
Use counter-moves to enter the trend
Patience & trend-following = Survival + Profit
█ What We Covered:
Part 1: Reduce Position Size
Part 2: Liquidity Makes or Breaks Your Trades
Part 3: Patience Over FOMO
Part 4: Trend is Your Best Friend
That's it! You've now completed the Mastering Volatile Markets series.
Stay calm, adapt quickly, and trade smarter — that's how you survive (and thrive) in volatile markets.
-----------------
Disclaimer
The content provided in my scripts, indicators, ideas, algorithms, and systems is for educational and informational purposes only. It does not constitute financial advice, investment recommendations, or a solicitation to buy or sell any financial instruments. I will not accept liability for any loss or damage, including without limitation any loss of profit, which may arise directly or indirectly from the use of or reliance on such information.
All investments involve risk, and the past performance of a security, industry, sector, market, financial product, trading strategy, backtest, or individual's trading does not guarantee future results or returns. Investors are fully responsible for any investment decisions they make. Such decisions should be based solely on an evaluation of their financial circumstances, investment objectives, risk tolerance, and liquidity needs.

What on Earth Is a Circuit Breaker?!Every couple of days since April 2nd, everybody's been talking about a stock market halt all day. You're left there trying to Google it so you're not the only person in the group chat who doesn't know what's going on. But actually, nobody else in your group chat knows what's going on either. They're low-key Googling it under the desk. You don't have to know everything in the market to be a "seasoned" trader. What does get disappointing is when people guess instead of providing facts or a direct link to an article about market halts.
So, this is your quick-but-detailed-read article/ guide to market halts and circuit breakers. Send it to your friends in that group chat. Why today's dump happened in the first place? More on that later. It's a long story. 🥹
What is a circuit breaker?
It's simple: a circuit breaker is a 15 minute OR whole-day market-wide HALT when the market reaches 1 of 3 decline levels. It all depends on the level, how fast the decline is, and potentially other factors that we are not aware of. Keep in mind this is not something we have to deal with often.
When does it happen? And what stock does it track?
Good question. The halt is triggered following declines in the S&P 500 only . That is: AMEX:SPY SP:SPX $CME_MINI:ES1!.
If these level 1 & 2 are reached before 3:25 PM EDT , there is a 15 minute market-wide trading halt. Meaning you cannot enter or exit positions. If level 3 is reached at any time in the day, the entire day's trading will come to an end.
Level 1: -7.00% | 15 minute halt
Level 2: -13.00% | 15 minute halt
Level 3: -20.00% | Entire day halt
So when the S&P 500 index reaches -6.98%, be sure a halt is coming very soon at -7.00%. Sure, like today, "they" might pump it and use that as support and prevent a halt (we got very close to -6.35% on CME_MINI:ES1! if I'm not mistaken). But it's good to be vigilant and make sure you're not in any daytrades.
Does CME_MINI:NQ1! NASDAQ:QQQ CBOT_MINI:YM1! trigger the halt also?
No. The halt is only triggered by the S&P 500. The Nasdaq Composite famously moves much more than S&P 500, so a 7% drop in S&P is way more dramatic than a 7% drop in Nasdaq and it's highly likely at -7% in S&P that Nasdaq would be at -8% or -9%. Although, both are undoubtedly decimating for any long positions.
Why does this rule exist?
This was introduced after Black Monday of 1987 where the market was free falling ( DJ:DJI dropped 22.6%) with no safety stops in place to prevent a market-wide disaster. This prevents further panic selling and massive stop loss raids, and also gives institutional traders time to zoom out and see the bigger picture.
How close did we get recently?
Today we got within 0.7% of getting a 15 minute halt.
See for yourself:
And the intraday 15 minute chart:
FUN FACT: What if I shorted the top on CME_MINI:ES1! ?
Assuming your time machine goes back 24 hours (some time machines only go back 10 years minimum), you'd have booked 1500 ticks at $12.50 per tick. So around $19k per contract. You know that's not too bad. It's almost a Toyota Camry per contract. Do better! 😆
How do I trade this?
Do you really have to? Please do not FOMO & catch a falling knife. Trade light. The market is open for the rest of the year. Trade with a stop loss, and remember, if you FOMO'd and bought at -3% just because it's down 3%, you'd have gotten decimated. Use the charts not the % on your screen. 🔥
Hit the follow button for free educational content because knowledge is free. KD out.

BTC UPDATE: Flash Crash? Or Bullish Retest?🚀 Hey Traders! 👋
If you’re enjoying this analysis, smash that 👍 and hit Follow for high-accuracy trade setups that actually deliver! 💹🔥
📉 BTC just dropped nearly $10K in a single day, sliding from $84K to $74K amidst growing tariff tensions and broader market turmoil.
But here’s the bullish twist—this dump might just be a healthy retest.
BTC recently broke out of a strong inverse head & shoulders pattern, and what we’re seeing now looks like a classic neckline retest.
📌 Key Support: $72K
As long as BTC holds above this level, there’s no reason to panic. Once the dust settles from this bloody Monday, momentum could shift back to the upside.
🟢 This could be a golden accumulation zone—low risk, high potential reward.
❌ Invalidation Level: Weekly close below $72K
💬 What’s Your Take?
Will BTC bounce from this level, or is there more downside ahead? Drop your analysis and predictions below—let’s navigate this together and secure those gains! 💰🔥🚀

So here’s what I’m doing: Not Panicking.This analysis is provided by Eden Bradfeld at BlackBull Research.
Listen, the US has survived the depression of WWI, the Great Depression, the depression of WWII, oil shocks, the dot com bubble, the GFC, the COVID-sell off. It’ll likely survive this.
In the scope of history, that $1 survived very well indeed. Panicking and running for the hills does not do so well. Winston Churchill was a great and flawed man but a terrible investor; he bought and sold shares prior to the 1929 crash in such speculative investments as mining companies, railways, and so on — most of them lost money (hence why Churchill continued to write at such a pace — to fund his Champagne-and-spec stock lifestyle). Hetty Green, on the other hand, (known as the “Queen of Wall Street”, managed to do very well her time — her quote?
I buy when things are low and no one wants them. I keep them until they go up, and people are crazy to get them.
Now, that’s something I can get behind.
Nobody wanted Meta a few years ago. I wrote an internal memo, close to its plummet in ‘22 (it got to $99 or so a share!). I wrote this:
ii) Yet what if we were to tell about about a company with this set of heuristics? Let’s call it “Company A”
Company A has a 31% return on equity and a 20% return on capital.
It has a net income margin of 37% and a FCF margin of 21%
Its income has a compounded annual growth rate over the last 5 years of 41%
If we add in numbers, now, let’s say the net income for 2020 was $29 billion, and $10 billion of that was used to repurchase stock from shareholders?
Let’s say the unlevered FCF is around $6 billion per quarter, and let’s say the debt to equity ratio is about 9x.
In other words, Company A is grows at a quick clip, and has done sustainably for the majority of its life. Its return on capital and return on equity would make any investor happy. Its FCF is an absolute machine.
Would you buy Company A?
Company A was Meta . You would’ve roughly made 4x or 5x’d your money if you’d bought around then. The point is, the fundamentals of a business matter, and right now there a quite a few exceptional businesses with good fundamentals trading at a good price. Alphabet (Google) trades at ~16x earnings. LVMH trades at ~18x earnings. And so on. Brown-Forman trades at ~15x earnings. These are all “inevitables” — Google will continue to be a dominant advertising platform, LVMH will continue to sell luxury, and Brown-Forman will continue to sell Jack Daniel’s and so on.
I talked to my ma in the weekend. She is not really a share person. Her portfolio is a bunch of “inevitables”. It’s done very well. She said “aren’t you worried about this stock market?”, and I said “You love supermarket shopping, Mum. If you see something at a 25% discount you buy it. You come home, and you’re delighted that you found some mince on special²”
She was like, “oh, that makes sense”.
The problem is you have a lot of people looking at charts and catching worry that the world will end. The world, I am delighted to say, has a magnificent disposition to carry on.

QQQ Selling Just StartingIf you have any illusions this will be a buy-the-dip market, you are taking on a major risk!
1. Last time QQQ sold off it lost 84%
2. It took 17 years to break even
3. It took much longer to break even inflation-adjusted
You can't buy low if you don't sell first. You don't have infinite money.
WARNING!

Market Update: NASDAQ 100 Analysis📈 The NASDAQ 100 is currently trading at 18,075.00, which represents a -22.6% decline from the all-time high of 22,425.75 . This marks a significant drop from its peak, entering into what could be classified as a bear market by traditional standards.
📊The previous decline from the high of 16,800.00 in November 2021 saw a decline of 37.47% , eventually bottoming out at the 61.8% Fibonacci retracement level (10,514.25), from which it staged a significant recovery to reach the all-time high of 22,425.75.
📊Current Demand Zones & Fibonacci Levels:
These zones represent potential reversal areas where buyers could regain control. The Fibonacci retracement levels align well with historical price action, reinforcing their significance as support zones.
DZ-1 (17,539.00-16,334.85): Approximately the 50% Fibonacci retracement of the recent bull rally
DZ-2 (16,334.85-15,384.25): Approximately the 61.8% Fibonacci retracement - Historically a strong support level
DZ-3 (15,384.25-14,557.00): Critical structural level with prior buyer interest
DZ-4 (14,557.00-14,140.25): Deep support level - key psychological zone
📈 Recovery Potential
To regain the all-time high of 22,425.7 5, the market would need to achieve the following percentage gains from each demand zone:
From DZ-1 (Top: 17,539.00, Base: 16,334.85): 📈 +37.3% to all-time high
From DZ-2 (Top: 16,334.85, Base: 15,384.25): 📈 +45.8% to all-time high
From DZ-3 (Top: 15,384.25, Base: 14,557.00): 📈 +54.0% to all-time high
From DZ-4 (Top: 14,557.00, Base: 14,140.25): 📈 +58.6% to all-time high
The DZ-2 to DZ-3 range provides the most likely region for a significant reversal based on confluence between historical support levels and Fibonacci retracements. While DZ-4 aligns with the 37% historical decline.
🔑 Key Takeaways
The NASDAQ 100 s is in a significant correction phase, down -22.6% from its peak.
Price is approaching critical Demand/support zones (DZ-1 to DZ-4), which may act as reversal points.
A return to all-time highs would require substantial gains, particularly if the market reaches the deeper demand zones.
Investors should closely monitor price action around the DZ-2 to DZ-3 range (15,384.25 - 14,557.00) for signs of a potential reversal.
Additionally, staying updated on developments related to the new tariffs is essential, as they may heavily influence market dynamics in the coming months.

Crude OIL CRASH - OPEC & Trump - Recession Catalyst#Recession is here, Markets are bleeding.
Crude #Oil is the kicker.
I shorted TVC:USOIL on Friday.
Hunting on this trade for a while now.
Very #Bearish outlook on #WTI.
MARKETSCOM:OIL Weekly
#FundamentalAnalysis
- #OPEC+ Output Hike (411K bpd)
- #Trump #Tariffs & #TradeWar
I'm looking at a #CrudeOIL #MarketCrash, similar to the #Covid era, when NYMEX:CL1! went in minus on #Nymex #Futures.
TVC:USOIL & my BIG SHORT
#Trading EASYMARKETS:OILUSD via CFDs with #Leverage.
Executed my #Sell Position on #WTI at $64.
* DYOR before, it's not a financial advice, I just share.
#TechnicalAnalysis
- #ElliottWave Impulse Cycle a (white)
- #Correction in Primary ABC (red)
- #LeadingDiagonal in Primary A (red)
- #Descending Triangle in Primary B (red)
Why will BLACKBULL:WTI Crash?
#Bearish Primary C (red) has started.
#Break-out below the Triangle Flat Line.
Important Note:
The #Bearish #Impulse will continue lower.
After the short-lived pull-back, Sellers will dominate.
$63-64 Range is the Entry.
MARKETSCOM:OIL Daily
TVC:USOIL #Short #TradeSignal
- Entry @ $63-64 Range
- SL @ $73
- TP1 @ $40
- TP2 @ $30
- TP3 @ $20
Stay in the green and many pips ahead!
Richard (Wave Jedi)

$SP500 $SPX Is the bull run over?#SP500 SP:SPX S&P500
Is this just a bull-run retracement or the beginning of a bigger crash?
Is the bull run over?
Every major crash started with an “innocent” 10–15% pullback. 🧐
It’s difficult to draw any conclusions right now, but once the current bounce is over, the next retracement will give us more clues. ⏳👀
Are you bullish or bearish? 🐂 🐻

DKNG Update | Crash AheadOne of the best fractal overlays I've seen with some Elliott Waves to go with it.
Price is still in a uptrend but with growing sellers It'll come to an end similar to the last fractal.
During the 3rd wave in the last pattern price experienced its first pullback at (B), and its second at correction wave 4 and the third after the last wave before we witnessed the last push in buyers.
This current cycle price is in a similar stage with a swing low at (b) meaning that we could see another run-up towards major resistance ($63).
This would be the final blow-off-top in general markets. TVC:RUT is already showing signs of weakness which works well with this TA example.
When the time is right I'll do another TA for the downfall. For now I'm bullish but for the horizon I'm very bearish.

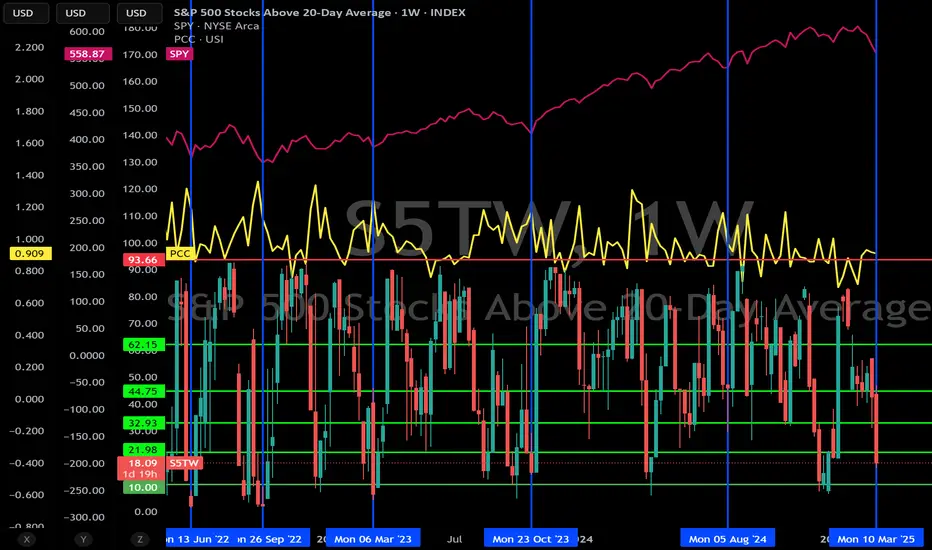
SPY, PCC & Percentage of S&P 500 Stocks Trading Above 20 SMASPY is in pink, PCC is in yellow and candles show S5TW (Percentage of S&P 500 stocks trading above their 20 SMA) on this weekly chart. You will notice after a significant drop of over 5% on S&P 500, once S5TW start getting below 20%, a reversal isn't that far away. Relief rally rips can be dramatic, so it really isn't the time to get bearish. Need to put that bull hat on! For now I am leaning after this retrace pump to 590 area, conclusion of B wave, but we still will put in a C wave which will likely head lower than where we finished A, but after that it will be one more impulsive wave to finish this bull run which should take us to SPY 650 by mid next year. Won't want to miss that one!!!
ETHEREUM CRASH TO $786! (UPDATE)Remember my ETH short bias from last September? Despite it pushing up a little, price has remained within the trendlines & bearish channel, keeping its main trend in a 'downtrend'.
We are still within a 3 Sub-Wave (A,B,C) corrective channel, with the current bearish move down being Wave C. Wave C target still remains around $786🩸

NASDAQ: Correction or Crash?!If this Monthly Chart for March holds then the NASDAQ:QQQ is COOKED!
Next Level: $450
Crash level: $370-$400 🥶
- Breaking out of WCB Trend
- Volume is WAY less than 202 Market Crash (Can get worse)
- Breaking out of Bullish Channel
- Topping tail wicks
Not financial advice

Russel 2000 Compared to General MarketTVC:RUT has continued to sell off since my last couple posts and I believe we could see a huge market correction this year if price doesn't look to stop selling.
The next play on RUT I would like to see price pullback to the last breakout zone ($2,200) to confirm a continuation in trend
This play also looks very familiar to the 2022 selloff with equal highs to our current price structure. Seeing that AMEX:SPY is at a higher high tells me there is market-wide divergence and a topping pattern could be in play.
Now when we add CRYPTOCAP:BTC and $OTHER to the mix we can see bitcoin actually tops out first while Alts and SPX look to make one more leg up before crashing out.
The Trend Reader at the lower tab has topped out and has a bearish crossing in the overbought zone indicating we can see a long term play to the downside.

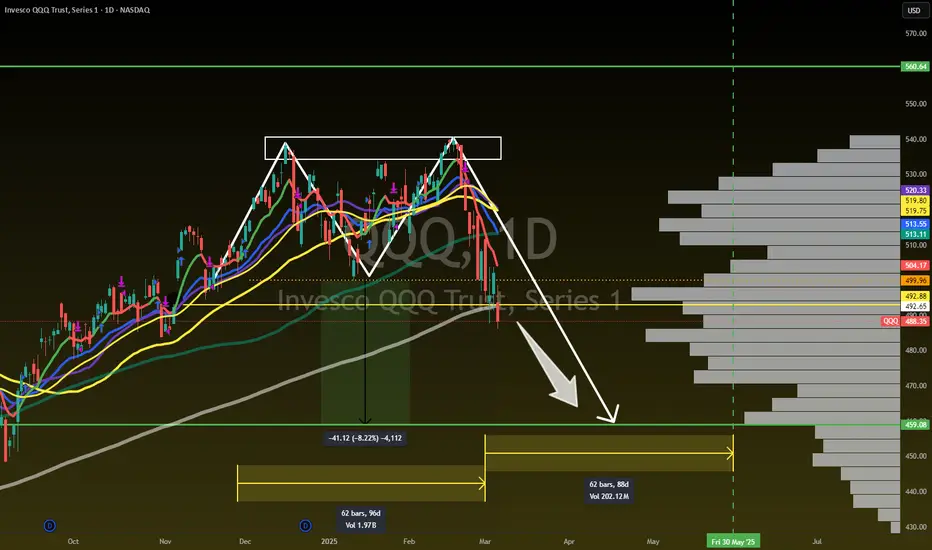
The Double Top is in on QQQNASDAQ:QQQ - DOUBLE TOP 🗻🗻
No Denying it NOW!
Measured Move is $459 by 30May
Not financial advice
Selling S&P close to the All time highWe are entering this trade because:
1) It is 10 pips away from the all time high
2) There is a harmonic pattern
3) Last weeks high
4) Triple top on H1 with divergence
Target would be 6000 to start off with but will monitor and take profit along the way.

RUS 2000 | Market Crash AheadDetailed analysis in regards to my latest video.
Comparing RUS to the general markets we can see that SPX is overperforming which can be used as a leading indicator to prepare for a possible crash to come most likely mid year Q2 - Q4 and bleeding into 2026.
I also added DJT to the mix and it also is underperforming to what the SPX is doing now days.
What does this mean for crypto?
We can see BTC attempt to make one more leg to the upside, no more than $300k and at least a 100% runup from current levels ~($108k).
Altcoins will most likely look to rip Q2 - Q3 as BTC.D struggles to run any higher.
DXY is also at a structural low ~(100) and will look to finish its goal to hit ~120.
My original call since 2021 was to see BTC hit $300k by 2025 - 2026. We'll see if price action surprises me!
My SPX call in 2023 also gladly hit $6,000..we'll see whats next to come👀

Stock market correction in 2025??I personally believe we'll see a stock market correction in 2025.
1. 30yr treasury yield going higher while FED cut interest rates. Similar situation in 1970s and 1980s where we say a 50% correction in just 2 years in the 1970s (can't remember exact dates)
2. US 10yr/3m yield curve has turned positive. Last times it's done this has been 2000, 2008 and 2020. I'm guessing you know what happened each of those times.
3. Institutional investors increasing long contracts in the yen. The Japanese Yen is a 'risk-off' investment and investors tend to favour it when they don't have much faith in the stock market.
4. US have a volatile president in Trump. The power also seems to be getting to his head a bit - he disagrees with Fed Chair Powell over interest rates, despite not being as educated in economics. He has a lot of power right now and I don't think he will be able to stop a potential market crash for the first year or 2 of his presidency.
5. Back-to-back 20%+ years from the S&P500, could be due a pullback.
These are some reasons, I have some more but I don't want to be sat here writing all day.
Important to note that if you're a long term investor it's best to just ignore this. "Time in the markets beats timing the markets" as they say.
But if you're a day trader I wouldn't be taking many long positions on stocks this year. Could be better to start looking at opportunities in the currency markets.
Then again - you don't have to trust me. This isn't financial advice, just my opinion.

The worst case scenario for Ethereum!I'm gonna make it real simple. Inverted head and shoulders is the pattern in lower time frame, therefore the price can start going up from here, breaks 4k and there will be the ult season an all that and the price can go up to 5.5K.
But
If Ethereum loses the 3K support and fails to hold 2.8K we are doomed BUT you will get the chance to buy ethereum at 1K again but then imo the price will bounce back tries to break the 4K resistance and if it does then even 6-7K will be possible.
if the worst case scenario happens alt coins won't drop that hard but many of them can form a double bottom pattern. So you might want to wait before buying and you might want to get yo $$$ ready to buy the dip.

Nifty Weekend Update...alert!!!!Hey guys, currently nifty this week fall more then 4%, due to holidays FII are selling highly.
If you see the chart you can see nifty currently just above of 50WMA after huge selling pressure it still above the 50WMA, if this will break next week onwards we will enter a bear market for short term period, so in my opinion this is now a crucial moment so keep cash in hand for buying in the dip.
Another scenario if nifty will bounce break from this level or first breaking 50wma then trap all bears and then bounce back above 50WMA that will also good for nifty to continue its trend to 30K.

Total Market Cap 2 and Total 3 + USDT.D Market WarningsIn this video, I briefly review the USDT.T bear market signals I covered in a recent video below.
But also noticing that Total 2, Total 3 and also the OTHERS are either hitting or very close to hitting their all time highs from the prior market cycle in 2021, which was the start of the Bear.
I do think we see more profit taking Monday afternoon into Tuesday through Thursday which is projected Dec 5th market cycle low from a cycles perspective.
Notice how the alts have been flying the last few days, and this weekend -- setting us up for major profit taking tomorrow and to fool all the new crypt tourists into buying the highs.
Protection capital here IMO and wait to buy back lower.
Let me know your thoughts, and please like the video if you found value.
- Brett
PS> My other Bear Market indicator fired today when I went out for Italian at my favorite local restuarant (sneaking in right at closing time as usual b/c I work 14 hour days)... and the bus-boy saw my Bitcoin hat -- and starting giving me crypto tips!
This is like the 'Taxi Cab' indicator of 1999, when the cabbie started giving me stock recommendations ... I had a feeling the top was in!

NIFTY STATIONS | WHERE IT CAN STOP or KEEP CONTINUE RUNNINGNIFTY Levels are estimated here.
Watch your position according to MARKET Reactions.
