Nifty Short , Medium & Long Term View-19-Feb-24 to 23-Feb-24Nifty Short , Medium & Long Term View-19-Feb-24 to 23-Feb-24
Nifty closed at 22040 (Last week 21540) and touched low & high of 21629 & 22068
RSI and stochastics levels reduced this week(58% & 87% Respectively). Stochastics is in overbought zone.
Huge volatility was seen last week within the topmost resistance and bottom most support last week. Market was exactly trading within this trend line resistance and trendline support provided.
Market need to decisively close above all time high 22117 and 22157 (Fib Resistance). Earlier 30% profit booking was suggested (except Bank & IT stocks). Partial Booking can be considered for further 5-10% in Mid & Small Cap (Stocks/ Mutual Funds) wherever valuation are high. There is no worry on Good Valued Stocks which can be kept for Long Term.
This cash will be useful to buy when during the fall.
Nifty IT 38477 (Prev Week 37699) -To continue hold. Nifty IT touched new high of 38477 in this week. Major support at 34918 /34000. Target can be 40000.
Nifty bank 46554 ( Prev Week 45634 ) -To continue hold. Nifty Bank touched 46695 high last week. Purchase on dips was suggested. Nifty Bank moved from 44673 to 46695.
support is at 44598 if breaks major support at 43650 ( Fib Support). Purchase on Dips.
Refer to detailed comments in the bottom.
Nifty 22040- Short Term ( Neutral )
All time high 22136 will be a key resistance. Market could not surpass it decisively. Hence bearish sideways movement expected for some more weeks.
Resistances are at 22000, 22117, 22136 ( All time high),22150
Support - 21430 (Fib Support & MA 50 Support), 20877 Fib Support and trend line support as shown in the chart.
Nifty Medium Term & long Term - Can buy at 20800 -21000 level in case of dip for a short run up.
Target Fibonacci extended resistance is near to 22500 as shown in chart. nifty will move to next target 22308 (Fib Resistance)/22521.
Support at 20225 (prev high), 20000 ( Fib Resistance)
Long Term
Market expected range bound between 22500 to 18800 expected till mid of 2024.
Q3 results are average except bank & Nbfc stocks, further up move will have target of 23150 ( Trend Line), 23500 ( Fib Resistance).
Comments (19-Feb-24) :
Earlier last 2-3 months, purchasing/holding Nifty IT at lower levels proved effective as the Nifty IT index as it moved up by 20%. Nifty IT posted flat or negative results in Q3. But to a surprise Nifty IT moved up 4-5% up as US economy is recovering. Nifty IT touched new high on 16-Feb-24 (38477). Target 40000.
Similarly despite nifty bank results for Q3 were good as expected, Nifty Bank index was down by 10% last three-Four weeks. Nifty Bank Index was suggested to buy two weeks before. Nifty Bank Stocks / Bank Index can be purchased whenever it falls down. HDFC bank is now in buyable range, can be further bought if it further dips for Medium to Long Term. Nifty Bank ( 46554) tried to move above key resistances. Continue to buy on dips.
As expected, stocks other than Banks have posted mixed results. Market can any time expected to turn volatile till elections in 2024 (Apr-May). Company Earning per share (EPS) are near to maximum level, expected policy / budgetary push to move up further in 2024. Individual stock pick will be the key in 2024.
Marketoutlook

Nifty Short , Medium & Long Term View-12-Feb-24 to 16-Feb-24Nifty Short , Medium & Long Term View-12-Feb-24 to 16-Feb-24
Nifty closed at 21782.5 ( Prev Close 21853 ) and touched low & high of 21629 & 22053
RSI and stochastics levels reduced this week( 54.5% & 65% Respectively).
Market is in indecisive state, could not take any direction as it could not surpass the previous all time high 22117 decisively. Earlier 30% profit booking was suggested (except Bank & IT stocks). Mid & Small cap Index fell buy 2.5-3% on 09-Feb-24. Partial Booking can be considered for further 5-10% in Mid & Small Cap (Stocks/ Mutual Funds) wherever valuation are high. There is no worry on Good Valued Stocks which can be kept for Long Term.
Interim budget announced was a status quo budget, no relief for income tax payers, no change in corporate tax, as expected Capex for infra (Railways & Road) increased. Infra Stocks, undervalued bluechip stocks can be considered based on the valuation.
Nifty IT 37699 (Last week 37323 ) -To continue hold. Nifty IT touched new high of 38368 in this week and then came below to 37699. Major support at 34918 /34000.
Nifty bank 45634 (Prev Close 45970) -To continue hold. Nifty Bank touched 44908 and then moved and settled 45634 Low last week. support is at 44598 if breaks major support at 43650 ( Fib Support). Purchase on Dips.
Profit booking upto 30% was suggested in the last 1.5 months, Cash is useful to pick the right stocks currently to pick the right stock. Purchased Nifty Bank at Jan 1st & 2nd week when it was low using that cash.
Refer to detailed comments in the bottom.
Nifty 21782- Short Term ( Neutral - Bearish Continued)-
All time high 22136 will be a key resistance. Market could not surpass it decisively. Hence bearish sideways movement expected for some more weeks.
Resistances are at 22000, 22117, 22136 ( All time high),22150
Support - 21430 (Fib Support & MA 50 Support), 20877 Fib Support and trend line support as shown in the chart.
Nifty Medium Term & long Term (Neutral)- Can buy at 20800 -21000 level in case of dip.
Target Fibonacci extended resistance is near to 22500 as shown in chart. nifty will move to next target 22308 (Fib Resistance)/22521.
Support at 20225 (prev high), 20000 ( Fib Resistance)
Long Term
Market expected range bound between 22500 to 18800 expected till mid of 2024.
Q3 results are average except bank & Nbfc stocks, further up move will have target of 23150 ( Trend Line), 23500 ( Fib Resistance).
Comments (11-Feb-24) :
Earlier last 2-3 months, purchasing/holding Nifty IT at lower levels proved effective as the Nifty IT index as it moved up by 20%. Nifty IT posted flat or negative results in Q3. But to a surprise Nifty IT moved up 4-5% up as US economy is recovering. Last two weeks IT was little down but comparatively lesser than Nifty Index and nifty Bank. Nifty IT touched new high on 08-Feb-24.
Similarly despite nifty bank results for Q3 were good as expected, Nifty Bank index was down by 10% last three-Four weeks. Nifty Bank Index was suggested to buy two weeks before. Nifty Bank Stocks / Bank Index can be purchased whenever it falls down. HDFC bank is now in buyable range, can be further bought if it further dips for Medium to Long Term.
As expected, stocks other than Banks have posted mixed results. Market can any time expected to turn volatile till elections in 2024 (Apr-May). Company Earning per share (EPS) are near to maximum level, expected policy / budgetary push to move up further in 2024. Individual stock pick will be the key in 2024.

Nifty Short , Medium & Long Term View-05-Feb-24 to 09-Feb-24Nifty Short , Medium & Long Term View-05-Feb-24 to 09-Feb-24
Nifty closed at 21853 ( Prev Close 21353 ) and touched low & high of 21429 & 22126
RSI and stochastics levels ( 58% & 74 % Respectively). Stochastics is near overbought zone.
Market closed all time high and moved higher comparative to last week but is in indecisive state, could not take any direction as it could not surpass the previous all time high 22117 decisively.
Interim budget announced was a status quo budget, no relief for income tax payers, no change in corporate tax, as expected Capex for infra (Railways & Road) increased. Infra Stocks, undervalued bluechip stocks can be considered.
Nifty IT 37323 (Last week 36496) -To continue hold. On the last day (Fri) of last week it was traded upto 1100 points and moved up. major support at 34918 /34000.
Nifty bank 45970( 44866) Moved 1000 points up compared to last week. support is at 44598 if breaks major support at 43650 ( Fib Support). Purchase on Dips.
Profit booking upto 30% was suggested in the last 1.5 months, Cash is useful to pick the right stocks currently to pick the right stock. Purchased Nifty Bank at Jan 1st & 2nd week when it was low using that cash.
Refer to detailed comments in the bottom.
Nifty- Short Term ( Neutral - Bearish Continued)- 21300 ( trend Line support Provided was major support last week.
Resistances are at 21439 ( Fib Resistance), 21639 ( MA 21 days) , 22000, 22117, 22155
Further below to 21300, 20800-21000 have strong Fib Support and trend line support as shown in the chart.
Nifty Medium Term & long Term ( Neutral)- Can buy at 20800 -21000 level in case of dip.
Target Fibonacci extended resistance is near to 22500 as shown in chart. nifty will move to next target 22308 (Fib Resistance)/22521.
Support at 20225 (prev high), 20000 ( Fib Resistance)
Long Term
Market expected range bound between 22500 to 18800 expected till mid of 2024.
Q3 results are average except bank & Nbfc stocks, further up move will have target of 23150 ( Trend Line), 23500 ( Fib Resistance).
Comments (04-Feb-24) :
Earlier last 2-3 months , purchasing/holding Nifty IT at lower levels proved effective as the Nifty IT index as it moved up by 20%. Nifty IT posted flat or negative results in Q3. But to a surprise Nifty IT moved up 4-5% up as US economy is recovering. Last two weeks IT was little down but comparatively lesser than Nifty Index and nifty Bank.
Simillarly despite nifty bank results for Q3 were good as expected, Nifty Bank index was down by 10% last two weeks. Nifty Bank Index was suggested to buy last week. Nifty Bank Stocks / Bank Index can be purchased whenever it falls down. HDFC bank is now in buyable range, can be further bought if it further dips for Medium to Long Term.
As expected, stocks other than Banks have posted mixed results. Market can any time expected to turn volatile till elections in 2024 (Apr-May). Company Earning per share (EPS) are near to maximum level, expected policy / budgetary push to move up further in 2024. Individual stock pick will be the key in 2024.

Nifty Short , Medium & Long Term View-29-Jan-24 to 02-Feb-24Nifty Short , Medium & Long Term View-29-Jan-24 to 02-Feb-24
Nifty closed at 21352 ( Prev Close 21571 ) and touched low & high of 21136 & 21736.
RSI and stochastics levels ( 47% & 21 % Respectively). Stochastics is in oversold zone.
Market saw huge volatility in the last two week of around 1000 Points, especially fluctuated after results of HDFC bank.
Nifty IT (36496) -To hold. major support at 34918 /34000.
Nifty bank ( 44866) if further move down support is at 44598 if breaks major support at 43650 ( Fib Support). Purchase on Dips.
Profit booking upto 30% was suggested in the last 1.5 months, Cash is useful to pick the right stocks currently to pick the right stock.
Refer to detailed comments in the bottom.
Nifty- Short Term ( Bearish)- 21300 ( trend Line support Provided was majr support last week.
Resistances are at 21439 ( Fib Resistance), 21639 ( MA 21 days) , 22000, 22117, 22155
Support at 21300 ( trend line Support), 20800-21000 have strong Fib Support and trend line support as shown in the chart.
Nifty Medium Term & long Term ( Neutral)- Can buy at 20800 -21000 level.
Target Fibonacci extended resistance is near to 22500 as shown in chart. nifty will move to next target 22308 (Fib Resistance)/22521.
Support at 20225 (prev high), 20000 ( Fib Resistance)
Long Term
Market expected range bound between 22500 to 18800 expected till mid of 2024.
however if Q3 results are good, further up move will have target of 23150 ( Trend Line), 23500 ( Fib Resistance).
Comments (28-Jan-24) :
Earlier last 2-3 months , purchasing/holding Nifty IT at lower levels proved effective as the Nifty IT index as it moved up by 20%. Nifty IT posted flat or negative results in Q3. But to a surprise Nifty IT moved up 4-5% up as US economy is recovering. Last two weeks IT was little down but comparatively lesser than Nifty Index and nifty Bank.
Simillarly despite nifty bank results for Q3 were good as expected, Nifty Bank index was down by 10% last two weeks. Nifty Bank Index was suggested to buy last week. Nifty Bank Stocks / Bank Index can be purchased whenever it falls down. HDFC bank is now in buyable range, can be further bought if it further dips for Medium to Long Term.
As expected, stocks other than Banks have posted mixed results. Market can any time expected to turn volatile till Feb budget & till elections in 2024 (Apr-May). Company Earning per share (EPS) are near to maximum level, expected policy / budgetary push to move up further in 2024. Individual stock pick will be the key in 2024.
In Feb, Temporary budget most likely to favour income tax payers inorder to keep in mind of elections and to concentrate on infra (Railways & Road). Infra Stocks, undervalued bluechip stocks can be considered.

Harvesting Risk Adjusted Gains in Bullish US Equity Markets Consistently harvesting positive gains is difficult. In markets where risks remain rife, that task gets harder. That’s where tactical hedging during periods of elevated risk help improve risk adjusted returns.
Analyst forecasts are for US equity performance to be neutral to bullish in 2024. Some believe that returns are likely to be dragged lower given the massive run-up in the final two months of 2023. Occurrence of a recession in 2024 could result in a sharp correction. Yet, a successful soft-landing combined with rate cuts by the Fed may drive markets even higher.
Uncertainty also persists over the upcoming US election. Election years generate an average of +7.3% returns over the last sixteen US elections. However, they also drive volatility.
Uncertainty is the only certainty for 2024. As seasoned investors and portfolio managers, forecasting is a fool’s errand. On any given day, time in the market is always better than timing the market.
ETFs could be a cost-effective way to gain exposure to the S&P 500 index, and they distribute dividends as well. Downside risks can be managed using CME’s short-dated equity index options around key economic events while maintaining a bullish stance on S&P 500.
US EQUITIES TO RALLY IN 2024 BUT NOT BY MUCH ACCORDING TO ANALYSTS
Most analysts are bullish on the S&P 500. Given a turbo charged finish in 2023, optimism remains muted on further upside gains as uncertainty persists.
Source – Business Insider
The colossal run-up in the S&P 500 and Nasdaq-100 over November and December has raised concerns of the market running ahead of itself on over expectations. The S&P 500 is 13.5% higher since 1/Nov while Nasdaq-100 has rallied 14.7%.
Yardeni Research, Oppenheimer, and Goldman remain bullish while JP Morgan and Morgan Stanley expect the benchmark index to give away some of the run-up during November and December due to high valuations, rising geo-political risks, and recession.
Oppenheimer believes market views of rate cuts in the first half of the year may be too optimistic. If Fed disappoints on rate timing and size of rate cuts, S&P 500 could witness drawdowns.
2023: A YEAR IN REVIEW
While inflation was stubborn all year, so was economic growth. US GDP growth in 2023 far surpassed expectations. Back in March, the Fed anticipated GDP growth between -0.2% to 1.3% in 2023. Come December, the Fed now anticipated GDP growth of 2.5% to 2.7%.
Inflation cooled much faster. Fed’s downward revision of inflation expectations points to peak interest rates. Amid the dovish outlook at its December meeting, markets rallied sharply in anticipation of accommodative monetary policy in 2024.
ANALYST MISSED 2023 S&P 500 TARGETS BY A SIGNIFICANT MARGIN
The final close of the S&P 500 was sharply higher than the most bullish forecasts from major banks at the start of 2023. The index was trading in the upper part of the forecast range for most of 2023 and squarely within the forecast range by HSBC, Goldman, and Citi until June.
Optimism of soft landing & on rising rate expectations drove the index well above the forecasts.
ELECTION YEAR IN THE US USUALLY DELIVERS POSITIVE RETURNS BUT UNCERTAINTY A RISK
2024 is an election year in the US. Election years on average deliver positive returns of +7.3% since 1960. Election years since 1960 have delivered positive returns 81.3% of the time compared to 68.8% for non-election years.
The results diverge for election years in which Democrats are elected (+5.6% returns) compared to Republicans (+8.9% returns).
Historical volatility during election years has been higher (18.6%) compared to non-election years (17.8%). However, the trading range during election years was marginally narrower (29.6% from low to high) compared to non-election years (29.9% from low to high).
Election years are generally viewed positively by markets but also tend to underperform relative to non-election years.
TIME IN THE MARKET TRUMPS TIMING THE MARKET
“Time in the market” has historically trumped “timing the market”. Staying invested for longer increases the likelihood of positive returns. Timing is hard, doing so consistently is even harder.
Source - Putnam Investment
Putnam Investments research shows that staying fully invested in the S&P 500 between 2008 to 2023 would deliver strong annualized returns of 10.6%. However, missing the 10 best days of the index during those 15 years would lead to annualized returns just half of that.
Instead of actively managing allocation towards equity indices in a portfolio, investors can opt to hold low-fee index fund ETFs such as SPDR S&P 500 ETF Trust (SPY) or iShares Core S&P 500 ETF (IVV), which offers:
• Low capital requirements relative to replicating index returns
• Decent dividend yield: SPY offers 1.39% dividend yield in 2023 while IVV delivered 1.44%
• Low expense ratios: SPY expense ratio is mere 0.09% while IVV charges a meagre 0.03%
To protect against drawdowns, investors can deploy long put positions on short dated Micro E-Mini S&P 500 (MES) options. Long puts on weekly MES options can protect against downside risk with relatively low premium. This makes them effective in managing event-driven risk.
KEY EVENTS CALENDAR 2024
Mint previously covered event-driven volatility within oil markets. Like oil, event driven volatility can cause outsized moves in equities too. For instance, in November upon the CPI release that showed inflation cooling, S&P 500 jumped 1.9%. Similarly, events can cause downside moves as well. In September, after a hawkish FOMC meeting, the index tanked 1.6%.
FOMC meetings and economic releases during 2024 could result in sharp moves in US equity markets, especially if they diverge from market expectations. Investors can trade the economic calendar by deploying short-dated options around these events.
CME offers weekly micro S&P 500 options for each day of the week. For the FOMC meeting outcome, which is released every Wednesday, the Wednesday or Thursday weekly options can be utilized. Similarly, CPI releases are typically on Tuesday-Thursday. Nonfarm payrolls are released on the first Friday of each month.
Put option premiums is a cost that can chip away at returns. Long-dated coverage during period of muted risk can result in wasted premiums. Instead, investors can focus their short-term hedges around the pivotal economic releases such as FOMC meetings to limit drawdowns.
ESTABLISHING TACTICAL HEDGES AROUND KEY EVENT RISKS
To maximize gains from long position in S&P 500 index funds, investors can tactically deploy short-dated CME Options on Micro E-mini S&P 500 Futures (“Micro S&P Options”) around key economic releases as well as FOMC meetings. Micro S&P Options offer low cost in premium and delivers downside protection from index drawdowns.
CME Group offers short-dated options on Micro E-Mini S&P 500 futures with expiries on Monday, Wednesday, Thursday, and Friday. Each weekly contract offers exposure to 1 MES futures contract or 5-times the index value.
In the lead up to key events, a portfolio manager will need to assess the notional value of their ETFs holdings and match it against the required number of options.
As an illustration, considering a long position in SPY on 2/Jan at an entry of USD 475.29; each SPY share offers exposure to 1/10th of the index value. To match notional value of the long ETF leg with the put options, 50 shares of SPY are required.
Based on data as of close of markets on 29/Dec/2023, weekly MES options points to an IV of 11% for ATM strikes. In case investors opt to acquire the weekly option a week prior to the economic release (7 days-to-expiry), the option would cost ~USD 150 (30 x 5) equating to 0.6% of the notional value.
If the index drops more than 0.6%, investors are protected from downside on their long ETF leg. However, where the decline is smaller than 0.6% or index rises following the release, cost of protection remains a cost to investor.
ILLUSTRATIVE EXAMPLE
As a hypothetical example, assume that the highest S&P 500 target for 2024 (Yardeni’s USD 5,400) is reached by the end of the year.
The path to the target is likely to vary with ups and downs. Assuming that 50 shares of SPY are acquired each month while implementing tactical hedges around FOMC meetings. Market performance and FOMC meeting performance is assumed to be randomly distributed based on past market performance.
The following table shows the net profit this strategy would generate through 2024 with and without the tactical hedges.
In the above example, the options hedges yield a net profit due to large hypothetical downside moves in July and September. In case the downside moves do not occur, the options legs would expire worthless and yield a net loss.
IN CONCLUSION
Signal of a Fed Pivot points to a bullish US equity market in 2024. However, raft of risks remains in sight across the horizon.
Prudent investors know well that investment gains are harvested by ensuring time in the market rather than timing the market. However, prudence also requires that exposures be astutely managed using tactical hedges that optimizes benefits versus costs of securing downside protection.
Here’s wishing all portfolio managers long returns and short risk going into 2024.
MARKET DATA
CME Real-time Market Data helps identify trading set-ups and express market views better. If you have futures in your trading portfolio, you can check out on CME Group data plans available that suit your trading needs www.tradingview.com
DISCLAIMER
This case study is for educational purposes only and does not constitute investment recommendations or advice. Nor are they used to promote any specific products, or services.
Trading or investment ideas cited here are for illustration only, as an integral part of a case study to demonstrate the fundamental concepts in risk management or trading under the market scenarios being discussed. Please read the FULL DISCLAIMER the link to which is provided in our profile description.

$EURUSD Bulls are Back once AGAIN? - LONGEURUSD Financial Review: Navigating Current Conditions and Projecting Trends"
Introduction:
The FX:EURUSD currency pair is currently poised for significant developments, with a projected bullish trend following a rapid correction. This analysis incorporates both trend and technical indicators, providing insights into the potential future movements of the pair.
Technical Analysis:
Our technical analysis, conducted on the 2-hour timeframe using the w.aritas.io indicator, reveals a convergence of probability bands, specifically the On-Balance Volume (OBV) and Relative Strength Index (RSI), as well as Money Flow with Moving Average Convergence Divergence (MACD). This convergence signals a stabilized market with reduced asset volatility, indicative of an equilibrium state. Minor fluctuations may trigger a bullish momentum, attracting further MoneyFlow into the asset.
Anticipated Bullish Boost:
We anticipate a bullish boost to commence as the pair approaches the critical zone around 1.08275 . Upon testing this zone, a light retracement is expected, followed by a resurgence of bullish momentum. This trend initially formed on October 16, 2023 , coinciding with positive movements in stocks and Treasury yields. Our projection suggests a continuation of this bullish trend towards our target profit zone, TP #2, around the 1.126 mark.
USD Strength and Economic Resilience:
In contrast to the EUR's projected bullish trend, we maintain the view that the USD is poised for broad strengthening into early 2024. This expectation is grounded in the economic resiliency of the United States and the Federal Reserve's cautious approach, with no imminent easing anticipated until the middle of the following year. These factors collectively position the Greenback favorably for the coming quarters.
JPY Weakness and Intervention Concerns:
Turning attention to the JPY, notable insights from Bloomberg.com highlight the potential for the yen to weaken by more than 10% due to the Bank of Japan's commitment to ultra-easy monetary policy. This contrasts with the Federal Reserve's tightening stance aimed at curbing inflation. The yen's potential decline, as suggested by Sakakibara, could reach levels near 160, prompting concerns of intervention by the Bank of Japan to mitigate its slide.
Additional Context:
For further context on the FX:USDJPY situation, readers are encouraged to explore the comprehensive analysis available at www.fxstreet.com This source provides valuable insights into the dynamics shaping the FX:USDJPY currency pair, offering a more detailed understanding of the factors influencing its movements.
Conclusion:
In summary, the FX:EURUSD pair is poised for a bullish trajectory , with technical indicators signaling a stabilized market. Concurrently, the USD is expected to strengthen, while the JPY faces potential weakness and intervention challenges. Traders and investors should remain vigilant, considering the nuanced interplay of global economic factors influencing currency markets.

EURUSD Outlook 2023/2024
The FOREXCOM:EURUSD has been mitigating the price zone of 1.12147 and 1.17122 since 2015, and had a rejection move from the zone on July.
On the 1W Time Frame:
1. Price did a change of character
2. Price tapped the 0.618 premium zone
There are 3 things that can happen
1. Price rejects the premium zone and pushes down
2. Price enters a more premium zone, then pushes down
3. Price breaks the structure high and pushes up
This is the overall outlook for FOREXCOM:EURUSD , check out some trading ideas that I have on my profile.

CCC Intelligent Solutions Holding Inc. Moon or BustChart was brought up on my stream today, and I wanted to post a chart. Looks like a nice run-up stock looking for a decent crash that should equal some pretty large percentage losses. Short term parabolic stock, so when those green trends break, the pump is pretty much over, and you'll want to start looking for an exit or short position on the retouch, which looks like it might end up being 13.9, but it's too hard to say right now, as those trends are held up on weak support.
CCC Intelligent Solutions Holding Inc. exhibits promising signs in its current chart analysis. On the daily timeframe, the Relative Strength Index (RSI) is indicating a bullish sentiment, although we haven't detected strong trend momentum yet. However, what makes this chart intriguing is the presence of a potential 'cup and handle' pattern nested within a larger 'cup and handle' formation.
Digging deeper into the 4-hour chart, we find crucial trend support, which has not been breached, and the RSI has yet to cross into bearish territory. This solidifies the foundation for a robust short-to-medium-term outlook.
Furthermore, a notable price gap has been observed at $12.5, providing an interesting point of reference for potential price movement.
The 1-hour RSI suggests a short-term correction may be on the horizon, supported by a subtle emerging trend. This could strengthen our 4-hour trendline, potentially setting the stage for a surge towards the $14 mark, with an optimistic stretch target of $15.72 in the event of favorable developments.
It's essential to note, however, that the 5-minute and 15-minute charts are currently showing signs of being overextended, indicating a need for caution in the short term.
In terms of price targets, we have an upper range of $13.9 to $14.05, while the lower range stands at $8.47 to $7.41. While a maximum price of $18 to $20 is not entirely out of the realm of possibility, it's essential to maintain a realistic perspective, and such levels may not be easily attainable.
In the unlikely event of a significant downturn, the stock could potentially dip below $5. In such a scenario, it's crucial to be prepared for a potential bounce when the drop stabilizes.
Looking ahead to the start of the trading week, should Monday open with a downward movement, it could present a compelling buying opportunity around the $12.54 mark, aligning with the prevailing trend. Such a move would also serve to reset the technical indicators, potentially paving the way for a push towards $14 and beyond.
In conclusion, CCC Intelligent Solutions Holding Inc. holds promise in its chart patterns and technical indicators, making it an interesting stock to watch. As with any investment, prudent risk management is advised, but the potential for exciting price movements in the coming sessions is certainly worth keeping an eye on.
Personally, I don't know if I'll give this stock another look, but I'll try to keep the prices update on my site, should it really start to get away from this chart. But overall, be careful, sell fast, and possibly try to enter a short position, it's a pretty nice setup, with limited but very real risk.
Analysis does not take any fundamentals into account. I've never heard of this company before.
Nick
Yolo to the Moon

SPY (S&P 500 ETF) - Bullish OutlookIn this technical analysis, I see the potential for a bullish trend in the SPY (S&P 500 ETF) based on historical data calculated using the ABC Calculator indicator and in consideration of the trend suggested by the Adapted Volume indicator. My outlook suggests a price target of approximately $450 USD within the next month.
1. Historical Analysis with ABC Calculator:
The ABC Calculator indicator has been a reliable tool for assessing historical price movements in the SPY. After a thorough analysis, it's evident that the SPY has exhibited several bullish patterns in the past, often following periods of consolidation or minor corrections. These historical patterns suggest the potential for a bullish trend to develop.
2. Adapted Volume Indicator:
The Adapted Volume indicator has consistently signaled strength in buying activity, indicating that market participants are showing increased interest in the SPY. This growing volume aligns with bullish market sentiments, as higher volumes often accompany upward price movements.
Price Target: $450 USD within 1 Month:
Taking into account the historical analysis and the current sentiment suggested by the technical indicators, I foresee a target price of around $450 USD for the SPY within the next month. However, it's important to note that the market can be influenced by various external factors, and this projection should be used as a guideline rather than a guarantee.
Risk Factors:
It's crucial to acknowledge that all investments carry inherent risks, and the SPY is no exception. Potential risks include economic events, geopolitical developments, and unforeseen market sentiment changes that could impact the bullish outlook. Traders and investors should employ risk management strategies to protect their positions.
In conclusion, the technical analysis indicates a bullish potential for the SPY, supported by historical patterns and the Adapted Volume indicator. However, it's important to stay informed about market developments and employ proper risk management to make well-informed investment decisions.
Please note that this analysis is for informational purposes only and should not be considered financial advice. Always conduct your own research and consider consulting a financial advisor before making investment decisions.

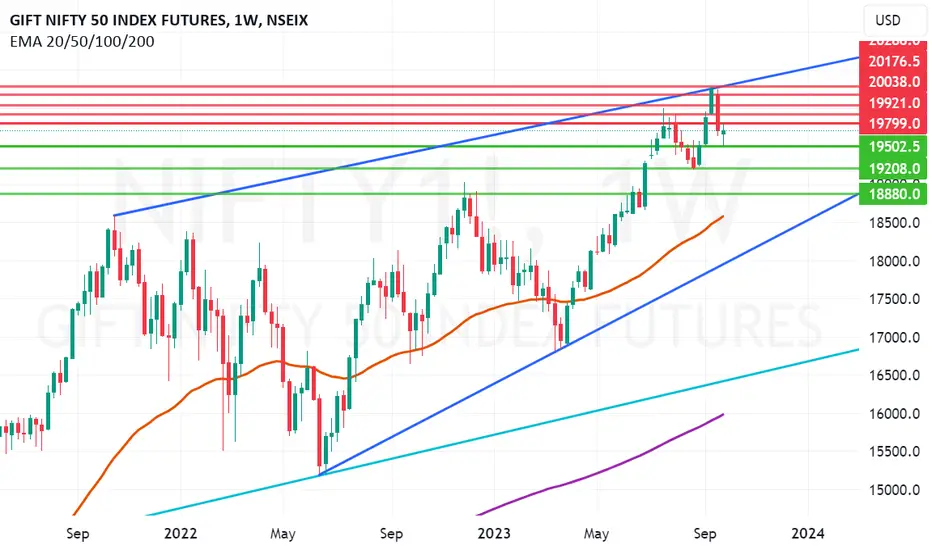
Nifty can bounce from Support. Nifty can bounce from Support if it can sustain above the levels of Friday high. That is 19799 tomorrow or in the coming week. In this case the resistances on the upper side will be 19921, 19991, 20038 and finally 20176. Supports for Nifty on the lower side remain at 19502 and 19208 on the daily chart. The momentum it gained on Friday should continue on Tuesday otherwise the Nifty will remain side ways for a few days. Crossing and closing above 19799 levels is crucial for fresh leg of rally to start in Nifty .
Once Again Nifty At Critical Support zone.Nifty Support zone is in between 19655 and 19544. A bounce back can be expected from any point within this zone. If the support at 19544 is broken then the bears will take further control of the market and drag it further down to 19224 or below. On the upper side the resistance levels for Nifty are near 19851, 19991.

A proper Breakout above the mid channel resistance for NiftyNifty has given a proper Breakout above the mid channel resistance showing bullish momentum. 20,000 points on Nifty along with G-20 can be the theme for the next week. For this to happen there are 2 important resistances which Nifty has to cross. These resistances are 19867 and 19991. Supports on the lower side for Nifty in case the breakout fails will be at 19720, 19516, 19360 and 19223. Trend changes to negative in case we get a closing below 19223.

Market is indecisive as it gave a perfect Doji. The market today gave a positive closing above 50 days EMA which was at 19285 which was a good sign but the candle that we saw today was a DOJI candle or a Perfect DOJI candle. This means that the market is indecisive. Only if the support at 19285 is held tomorrow or for the reminder of the week, Nifty can think of a recovery. Supports on the lower side for Market are 19285, 19229, 19145 and 19024. Below 19024 the market can fall upto the levels of 18861 or more. On the upper side the resistances will be at 19367, 19488 and 19587.

First Signals of Bull Rally cooling down.The 1.17% negative fall in stock market today courtesy weak guidance for 2024 by Infosys set the cat amongst the pigeons and profit booking in major sectoral indices lead by IT started. Capital goods and PSUs index were trying to provide some support and respite to the Nifty. On weekly chart the zone between 18887 and 50 weeks EMA which is at 18000 looks like major support zone. Before Nifty reaches this zone there will also be supports at 19565 and 19117. In the worst case scenario of some major bad news 16856 and 200 Weeks EMA of Nifty which is near 15566 can also provide major support. (Highly unlikely Nifty reaches there but you never know). Resistance on the upper side for Nifty remain at 19747 and 19991. Long term target for Nifty is first 20002 and then 21035.

Nifty Delicately placed between support and resistance zones. There are three major supports for Nifty on hourly channel near the current level. The supports being at 19354, 19295 and 19232. Falling below 19232 will take spot Nifty to the levels of 19065 or 18894. Below 18894 Nifty becomes very week and final major support for Bulls will be at 18651. Resistance for Nifty will be near the levels of 19437 and 19523. Crossing and closing above this zone is difficult but if Nifty closes above 19523 channel top resistance will be in the zone of 19590 to 19610.

USD/CHF Technical Analysis - SELL
NFP data is very bearish for the Greenback and all USDxxx related instruments.
The price formed a high momentum bearish candle on a daily on Friday.
Bears will most likely keep dominating on the market.
Target level - 0.8845
Please, support this post with like!

Supports and Resistances for Nifty from current levels.Hourly chart of Nifty suggests support for Nifty in the zone of 19268 and 19232. If 19232 is broken the next support will be near 19065. Below 19065 Nifty is vulnerable and can fall to the levels of 18859 or 18651. Below 18651 bears will awaken from Coma they are in currently. Trend changes to negative below 18651 closing. Resistance on the upper side for Nifty are near 19411. 19506 to 19551 will be a major resistance for Nifty as that is the top of current channel.

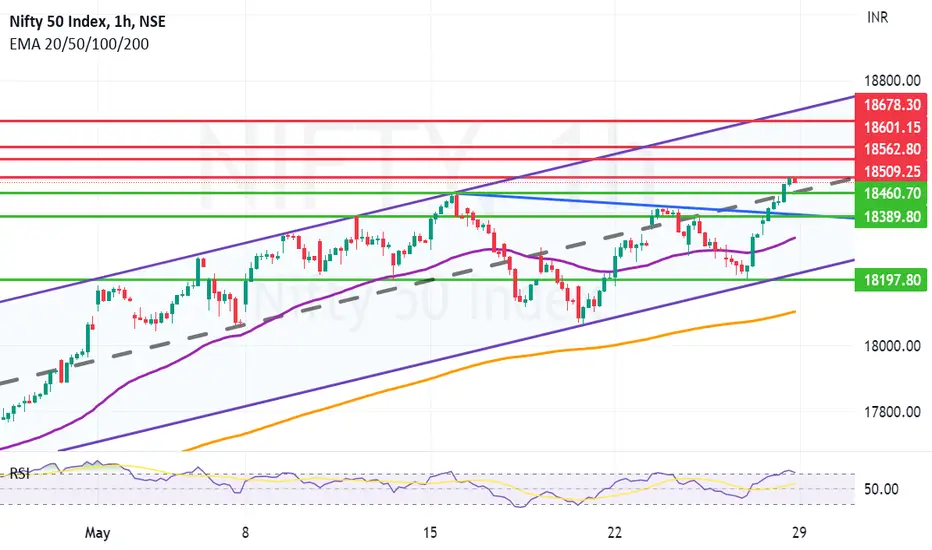
Strong Close by Nifty on Friday.Nifty has given a strong closing on Friday by closing above the Mid Channel line. The nifty has given a close just below a strong resistance of 18509. 18509 was high of Friday above which the Nifty could not close. One way to avoid this resistance would be to open gap up on Monday. If we open gap up on Monday above 18509 levels, the next resistance will be at 18562, 18601 and 18678. Supports on the lower side will be at 18460, 18389, 18324 (50 Hours EMA) and 18197. Below 18197 Final support will be 200 Hour EMA at 18101. Below 18101 Bears will regain the control. If by chance during the week or later this month or next month we get a closing below 18101 trend can change into negative.
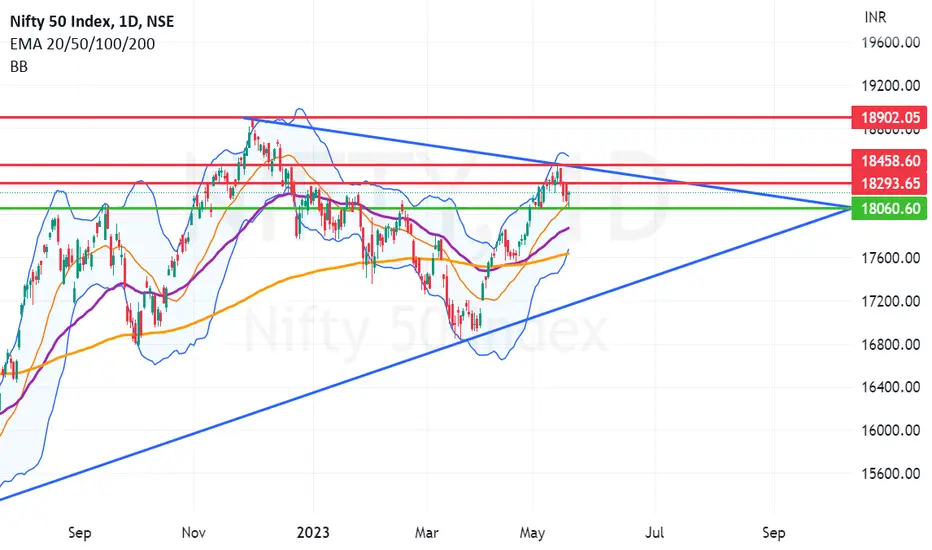
Soft Landing of Nifty after Karnataka Election Results. Nifty made a soft landing after Karnataka Election results. Despite Global markets performing well Nifty had a subdued week. After starting the week well, the rally simply could not sustain the upper levels and continued to slide.
Bollinger Band and Daily chart technical analysis shows Friday low of 18060 and 18107.5 as strong support for Spot Nifty. Below these levels if 18060 broken Nifty can slide further to 17873 and 17636. The zone between 17636 and 17675 is strong support buffer zone. Resistance on the upper side will be at 18293, 18458 and 18539.
Panic selling on Friday but Nifty closed above critical support.Market Outlook For The Next Week:
It was a volatile week which saw ups and downs. Downs mainly due to huge sell off in HDFC Twins due to the rebalancing news of MSCI Index. The fall also cooled down RSI which has come down substantially. Closing of Nifty well above critical support level of 18029 shows that strength still might be left in NIFTY to rally again a bit further next week. Support and Resistance levels for Nifty for Next week are under.
Nifty Support Levels: 18055, 18029, 17936 and finally 17843.
Nifty Resistance levels: 18172, 18216, 18268 and finally 18425.

Proper Clean Breakout For NiftyWe can expect BOOM BOOM BOOM tomorrow or in the coming week. It is a clean Breakout for NIFTY50. Support Levels are at 17779, 17687 and mega support of 17541 to 17584 zone. On the upper side the resistance are near 17986, 18042, 18272 and 18466. Let us see how far the Fizz can take us tomorrow. More importantly can the Fizz last over the next week too?

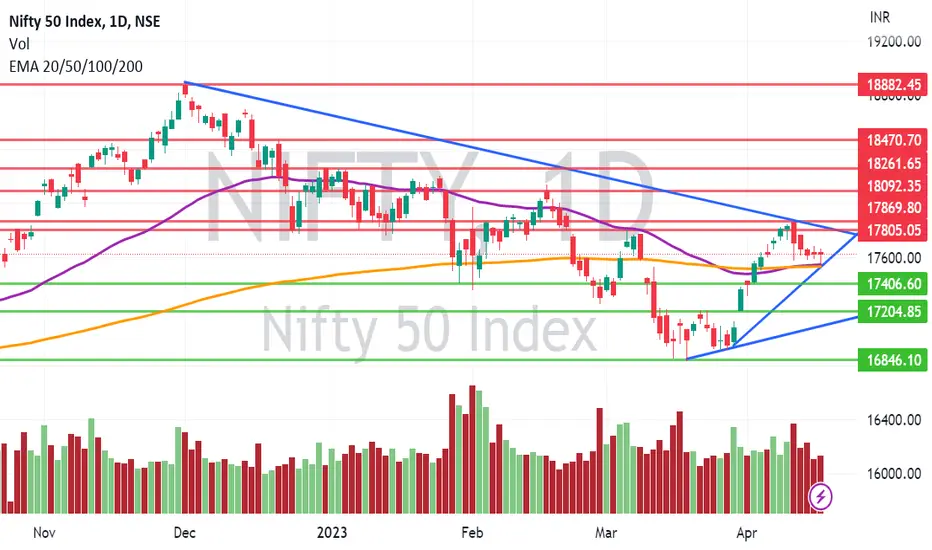
Very buoyant forces keeping Nifty afloat and going higher. Nifty on the back of momentum in Small and Mid cap stocks combined with some good results is taking Nifty higher after a week of consolidation. If 17863 is taken down we may see the rally continue to upto 18092, 18360 and above. 17532 to 17552 are strong supports as the levels are 50 and 200 days EMA. If 17532 us broken the other supports are near 17467 and 17198 levels.

Nifty at a critical support. 50 and 200 days EMA have been providing a critical support to Nifty all throughout the week. 50 and 200 days EMA stand at 17544 and 17530 respectively. This zone has provided support to the Nifty almost on all days of the week proving that it is the most critical support. If this support is broken Next support for Nifty will be only at 17406 and further down at 17204 levels. However if Nifty is assured of its support the chances are that it can rise from here. The resistances that it can meet on the way up are near 17805, 17869, 18092 and 18261 levels.