PTON Break Out In progressTrade Ideas
- buy the stock target 110 with SL below SMA20 daily
- buy Call 95 OCT16
Markets


Bitcoin: Sell trade active, H&S on the hourly chartBitcoin fell below $10,800 on Monday, activating my sell trade on the top cryptocurrency.
Now the hourly chart has formed a head-and-shoulders pattern. The cryptocurrency is currently probing the neckline support, which if breached would strengthen the case for a decline to $10K.
here is the short trade I shared yesterday: Bitcoin: Sell below $10,800 (Bitstamp price)

Bitcoin: Sell below $10,800 (Bitstamp price)Bitcoin's weekly chart shows:
Downside break of bull market trendline
MACD has dropped below zero.
BTC charted a hanging man bearish candle last week.
5- and 10-week SMAs have produced a bear cross.
Trade: Sell below $10,800 target $10,000, $9,800 stop loss $11,200

Weekly Review: Remaining Bearish (Read for Fundamentals) Let´s order the weekly ideas:
1. Executive committee of the ECB will speak on Monday, maybe give some new updates about negative interest rates
2. Tuesday is about confidence indicators which I expect them to fall
3. Rest of the week is mostly about US employment and first debate on Wednesday between Biden and Trump
Regarding the markets, new outbreaks have put the recovery on hold and the consumer sentiment is being affected and is becoming a warning factor for the markets in the short-term. Moreover, the vaccine discovery has been delayed.
Facing the week, we have a weak market where none of the events of the short-term has the potential to turn around the bearish sentiment.
- Advise to take a short position for the week.
(Follow me for more weekly analyses and how to position your market portfolio regarding the upcoming elections)

everything depends on DXY in last week , Dollar index movement make noise in all Major Trading instruments like XAU XAG EUR GBP Trading Setups ,
Traders and Trading institutions Feel more risk on the DXY New Price and a lot of them liquid their positions to Hedge The risk with more Liquidity
Powell Testimony was Most Important Event Of the week and when he said there is no enough debt and cash to guaranty the 2% estimated Inflation rate DXY All major instruments Experienced High Volatility last night
now , the last hope for Bulls Against Dollar is a rejection from the red trend line on DXY with Reliable Price Action
sincerely AHZ

QQQ No Sign of a Bottom Here!QQQ looks very weak here and our LT Oscillator (Blue Dots) are suggesting a much bigger move to the downside is coming.

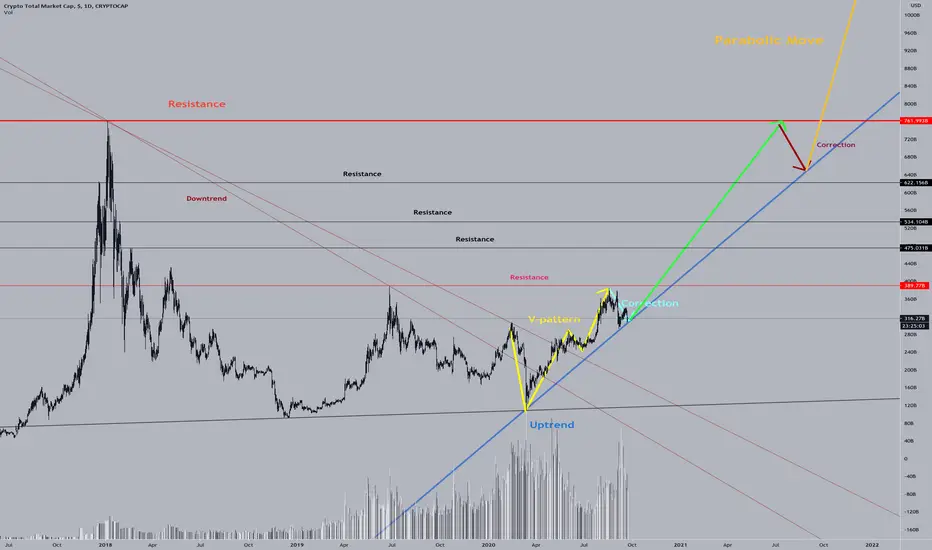
Bulls Are Running!!The picture seems clear to me.
Enter the market now and exit your positions in 2022.
95% of my predictions work. I hope this one is NO exception.

EURGBP H1 - Long Trade SetupEURGBP H1 - Break and retest seen here on EG, sequence of HH's and HL's to continue the upside trend.


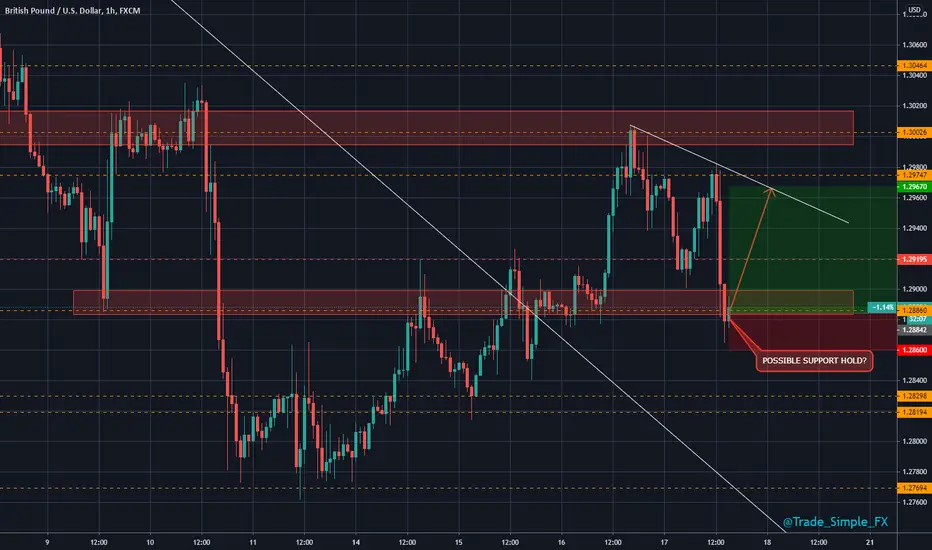
GBPUSD H1 - Long Trade SetupAggressive selloff fueled by BOE. Other GBP pairs seem like they want to start correction, we have some sort of support zone here on GU, but still very active with bearish markets, interested to see if current price holds as support.
Gold H4 - Long SetupGOLD H4 - Huge dump at the trendline resistance, dumped circa 200 pips down to the next S/R zone, could be a region where we start to gear up for a second attempt to break the descending structure/resistance.

GBPUSD H4 - Short Trade SetupGBPUSD H1 - Another H1 chart here for a GBP pair. If we can push up again to test 1.29 possibly, that could warrant a good rejection to see us back down to the previous low region again and then possibly beyond.

EURJPY H4 - Long Trade SetupEURJPY H4 - Seen a little lift here on EURJPY, bounced from support initially, not sure how much mileage this has, but we need to break that sequence on lower highs shown from between 10th and current date.

EURGBP H1EURGBP M30 - Saw a break and retest of this pennant last week, but this was quite late during the week and markets then closed, and also failed to set new highs beyond the breakout high. I'm neither bullish or bearish on this until we hear more from the vote later on today. This will then set the tone going forward for the GBP markets and to a degree the EUR markets

GBPUSD H4 - Short Trade SetupGBPUSD H4 - Breaking the corrective consolidation from last week (the flag consolidation range). Possibly could see market correction up towards the previous S/R zone. Again big moves expected later off the back of the vote this evening.

Weekly Review: Healthy Correction Needed (Read for Fundamentals)I believe this recent correction in the markets is more of an eventual profit taking event rather than a structural adjustment. The technology sector still offers growth potential in the medium term. It is logic and healthy for the market to correct after such a strong bull run.
Looking forward into the new week:
1.Central bank meetings
No change in interest rates expected, will maintain dovish position.
2.Indicators
In macro terms, indicators will keep recovering.
Lateral week is expected consolidating the levels from previous weeks. In medium term, slightly more bullish position despite big volatility also being expected.

EURJPY H4 - Short Trade SetupEURJPY H4 - Gains seen for the EUR off the back of ECB and Lagardes comments. She's pushing she euro up nicely to break the previous S/R zone at 125.400. Hopefully we find resistance around that 126.650 region.

GBPJPY H4 - Short Trade SetupGBPJPY H4 - As mentioned, the system doesn't change just because the environment has changed. Setting an alert for 138.000, this is a 382 corrective point, whole number, weekly and local support zone, so 4 confluences there. Will see where we are and how we are looking as/if we hit 138.000 for possible shorts.

3 Rising Valleys on USD Currency Index (DXY)Hidden bullish divergence after a 3 rising valley formation and coinciding decade-long critical up-sloping support on the DXY could indicate a major reversal, or alternatively major break to the downside to re-test the all time lows.

EURJPY H1 - Long Trade SetupEURJPY H1 - Really nice technical play here, but yet to find out what's caused that sudden YEN strength, video analysis coming through now.

$USOIL #CrudeOil - Buyer here into $44/$45+ invalid below $42good RRR on this buy
entry @ $43
invalid below $42
$44 / $45 profit scaling levels
Can leave a runner open if you feel comfortable with the long term bias
Personally I believe we can see $50+ by year end
