$GEN - Still Could Reach HigherGenesis Healthcare, Inc. is a holding company, which engages in the provision of inpatient services through skilled nursing and assisted and senior living communites. It also offers rehabilitation and respiratory therapy services. It operates through the following segments: Inpatient Services, Rehabilitation Therapy Services, and Other Services. The Inpatient Services segment manages operation of skilled nursing facilities and assisted/senior living facilities. The Rehabilitation Therapy Services segment provides rehabilitation and respiratory therapy services. The Other Services segment comprises of other specialty medical services, including physician services, staffing services, and other healthcare related services. The company was founded in 1985 and is headquartered in Kennett Square, PA
SHORT INTEREST
4.27M 09/30/19
P/E Current
-0.59
P/E Ratio (with extraordinary items)
-1.00
Markets

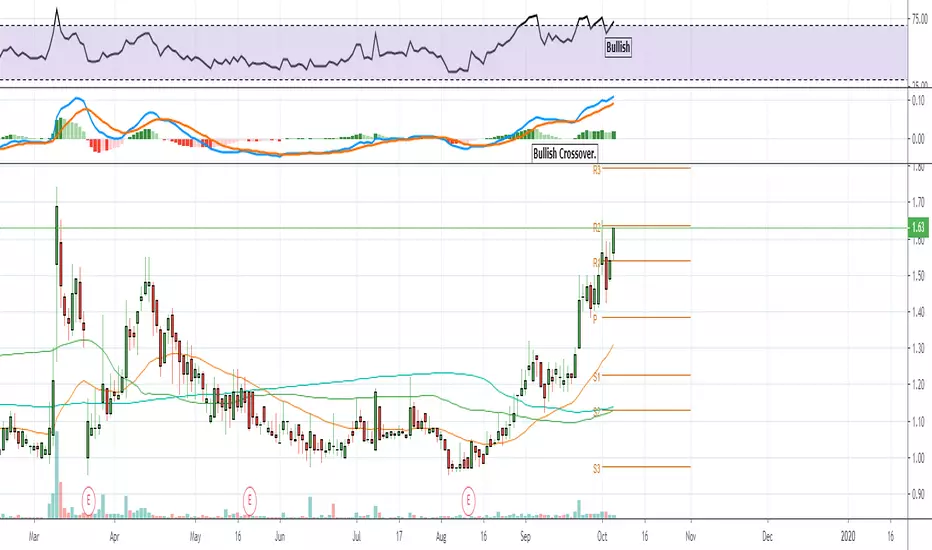
$PFIE - Bullish Trend - Could go beyond $2.40Profire Energy, Inc. engages in the development of burner-management technologies used on a oilfield natural-draft fire tube vessels in oil and gas industry. It offers line-heaters, dehydrators, separators, treaters, amine reboilers, and free-water knockout systems which facilitate the proper function of the vessel. The company was founded on May 5, 2003 and is headquartered in Lindon, UT.
SHORT INTEREST
317.87K 09/30/19
P/E Current
15.22
P/E Ratio (with extraordinary items)
17.59
P/E Ratio (without extraordinary items)
11.74
Average Recommendation: OVERWEIGHT
Average Target Price: 3.45

$CLWT - Move Above MA's Trend Possibly StartingEuro Tech Holdings Co. Ltd. engages in the manufacture and distribution of water treatment equipment, laboratory instruments, analyzers, test kits and related supplies, and power generation equipment. It operates through the Trading and Manufacturing, and Engineering business segments. The Trading and Manufacturing segment sells water and waste water related process control, analytical and testing instruments, disinfection equipment, supplies, and related automation systems. The Engineering segment involves the development, engineering, production, sales, and servicing of environmental protection equipment, energy conservation, and related products. The company was founded in 1971 and is headquartered in Hong Kong.
SHORT INTEREST
8.21K 09/30/19
P/E Current
-5.73
P/E Ratio (with extraordinary items)
93.31

$SGMA - Bullish Breakout To Come?SigmaTron International, Inc. engages in the provision of electronic manufacturing services. The firm also manufactures printed circuit board assemblies and assembled electronic products. It offers automatic and manual assembly and testing of products; material sourcing and procurement; manufacturing and test engineering support; design services, warehousing and distribution service; and assistance in obtaining product approval from governmental and other regulatory bodies. The company was founded in November 16, 1993 and is headquartered in Elk Grove Village, IL.
SHORT INTEREST
12.56K 09/30/19
P/E Current
-20.53
P/E Ratio (with extraordinary items)
791.19

$DHXM - Retracement To Come But Good Opportunity DHX Media Ltd. engages in the production and distribution of content, television, and consumer products representation. It operates through the following segments: Content Business, DHX Television, and CPLG. The CPLG refers to the management of copyrights, licensing and brands for third parties. The company was founded by Charles William Bishop, Steven Graham DeNure, and Michael Patrick Donovan on February 12, 2004 and is headquartered in Halifax, Canada.
SHORT INTEREST
2.12M 09/30/19
P/E Current
-2.94
P/E Ratio (with extraordinary items)
-2.94
Average Recommendation: HOLD
Average Target Price: 2.02

$ANTE - NEW But Bullish Run In MotionAirNet Technology, Inc. engages in selling advertising time slots on air travel advertising network. It also sells advertisements on digital television screens on the airplanes. The company was founded by Herman Man Guo in 2005 and is headquartered in Beijing, China.
SHORT INTEREST
51.88K 09/30/19
P/E Current
-0.16
P/E Ratio (with extraordinary items)
-0.18
Average Recommendation: OVERWEIGHT
Average Target Price: 34.50
$TLF - Bull Divergence + FIB Retracement = Perfect Tandy Leather Factory, Inc. engages in the distribution of leather and related products. It offers leather, leatherworking tools, buckles and adornments for belts, leather dyes and finishes, saddle and tack hardware, and do-it-yourself kits. It operates through North America and International geographical segments. The North America geographical segment consists of 115 stores, which offer a broad selection of products combined with leathercraft expertise in a one-stop shop. The International geographical segment comprises of similar to North America segment but generally located in light industrial areas. The company was founded by J. Wray Thompson, Sr. and Ronald C. Morgan in 1980 and is headquartered in Fort Worth, TX.
SHORT INTEREST
138.72K 09/30/19
P/E Current
22.00
P/E Ratio (with extraordinary items)
27.18
P/E Ratio (without extraordinary items)
26.57

$SGRP - Trend Retracement Complete - Possible 15% MoveSPAR Group, Inc. engages in the provision of merchandising and marketing services. It operates through the Domestic and International segments. The Domestic segment covers services in the United States of America since certain of its predecessors were formed. The International segment offers merchandising, marketing, audit and in-store event staffing services in Australia, Brazil, Canada, China, India, Japan, Mexico, South Africa, and Turkey. The company was founded by Robert G. Brown and William H. Bartels in 1967 and is headquartered in White Plains, NY.
SHORT INTEREST
30.26K 09/30/19
P/E Current
-14.14
P/E Ratio (with extraordinary items)
10.04

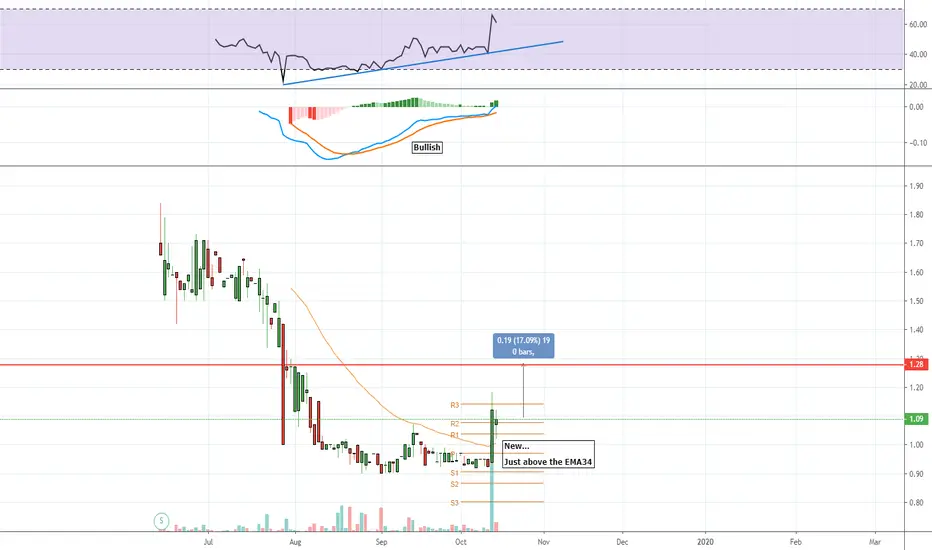
$PETZ - Always pumps - Be Careful But Use The MomentumTDH Holdings, Inc. engages in the manufacture and distribution of pet food products. The company's main five product lines are pet chews, dried pet snacks, wet canned pet food, dental health snacks, and baked pet biscuits. It offers dried meat, fish pet food, cat food, vegetarian pet food, dog chews, wet canned, biscuits, dog leashes, pet toys, and dentifrice products. The company was founded by Rong Feng Cui in April 2002 and is headquartered in Qingdao, China.
SHORT INTEREST
337.61K 09/30/19
P/E Current
-0.77
P/E Ratio (with extraordinary items)
-0.78

$ICON - Continuation Trendline Holding Strong Iconix Brand Group, Inc. engages in the ownership, licensing and markets a portfolio of consumer brands is a brand management company. It operates through the following segments: Women's, Men's, Entertainment, Home, and International. The company was founded in 1978 and is headquartered in New York, NY.
SHORT INTEREST
390.59K 09/30/19
P/E Current
-0.13
P/E Ratio (with extraordinary items)
-0.31
Average Recommendation: BUY
Average Target Price: 8.00

$SYPR - Bullish Trend Holding - Can It Carry On Sypris Solutions, Inc. engages in the provision of technology-based outsourced services and specialty products. It operates through the following segments: Sypris Technologies and Sypris Electronics. The Sypris Technologies segment involves in the selling of forged, machined, welded and heat-treated steel components and subassemblies including commercial vehicle component parts, high-pressure closures and other fabricated products; and manufacturing services for truck components and assemblies. The Sypris Electronics segment includes circuit card and full box build manufacturing, high reliability manufacturing, systems assembly and integration, design for manufacturability and design to specification work. The company was founded in 1997 and is headquartered in Louisville, KY.
SHORT INTEREST
7.22K 09/30/19
P/E Current
-6.32
P/E Ratio (with extraordinary items)
-5.52

Brexit breakthrough and markets bet on the breakthrough in US-ChThere were no major breakthroughs at the meeting between UK Prime Minister Boris Johnson and his Irish counterpart Taoiseach Leo Varadkar over the Irish border backstop. Recall that today it is the main sticking point that stops signing an agreement with the EU. As a result, the GBPUSD soared more than 250 points.
However, this is not the end so you should not relax. Next week, the EU summit will take place, from which markets are waiting for a final decision on Brexit. Current options for the development of events include an agreement with the UK, another delay or exit without a deal.
We have been supporting pound purchases for a long time since we believe in Brexit deal.
Negotiations between the USA and China continued to be the hottest one. Trump said the talks went well. Today, Trump will host Liu He, Vice Premier of the State Council of the People's Republic of China, in the White House, so surges in volatility in the financial markets are still likely.
The markets seemed to be imbued with Trump's confidence, as demand for the Chinese yuan in the options market sharply increased (over the past 24 hours, traders bought two-month options in the dollar/yuan with a strike at 6.95 for $ 650 million). That is, traders are trying to prepare for the success of the negotiations and are waiting for the renminbi to strengthen.
trading decisions have to be made with an eye to a possible change in the existing fundamental background.
Regarding our position on safe-haven assets, today we will not recommend buying gold or the Japanese yen. The situation is too unpredictable, and the risks are too high. Our recommendation for today is the adaption to any negotiation outcome.
The success of negotiations between the United States and China, in theory, will be accompanied by haven assets sales. Accordingly, you can act respectively, with that. Yesterday, pound dynamics showed that even a late call could bring significant profits.
If negotiations fail, you can act respectively purchasing gold and the Japanese yen.
In terms of macroeconomic statistics, Employment Change in Canada is what we are interested in. So today is an interesting day to work the Canadian dollar.

OXBR - Buyers In Market - Huge Move HappeningOxbridge Re Holdings Ltd. is engages in the provision of reinsurance business solutions to property and casualty insurers in the Gulf Coast region of the United States. Through its subsidiaries, it fully collateralizes policies to cover property losses from specified catastrophes. The company was founded on April 4, 2013 and is headquartered in George Town, Cayman Islands.
SHORT INTEREST
3.02K 09/13/19
P/E Current
-0.92
P/E Ratio (with extraordinary items)
-0.86
Average Recommendation: BUY Average Target Price: 8.50

The value of recognizing expanding and contracting marketsvideo explains the significance of recognizing contracting markets.

Very bullish on SPY. No concern of recession. Going up!!I published 2 videos this morning on my YouTube channel - Dumb Money Trader. The first was on why the market is up today, and the second was showing you my analysis on this very chart publishing here on Trading View.
Check out the videos, hit the like button, and subscribe if you haven't already. I'm working on other video projects for the channel, and I think y'all will like what I have to share. My videos will only get BETTER from this point on.
You can also visit my free blog - www.DumbMoneyTrader.com - for news, insights, analysis, and tutorials.

VTGN - Perfect Retracement - Bulls in controlVistaGen Therapeutics, Inc. is a clinical-stage biopharmaceutical company, which engages in the development of new generation medicines to treat diseases and disorders of the central nervous system. Its portfolio focuses on three clinical-stage product; neuropathic pain (NP), levodopa-induced dyskinesia (LID), social anxiety disorder (SAD) and suicidal ideation (SI). Its product include AV-101 product and PH10 neuroactive nasal spray.The company was founded by H. Ralph Snodgrass and Gordon Keller on May 26, 1998 and is headquartered in South San Francisco, CA.
SHORTS 1.79M 09/13/19
P/E Current
-1.08
P/E Ratio (with extraordinary items)
-1.49
Average Recommendation: OVERWEIGHT
Average Target Price: 2.35

PXS - Bullish Momentum Gaining StrengthPyxis Tankers, Inc. is an international maritime transportation holding company, which engages in the maritime transportation business with a focus on the tanker sector. It acquires, owns, and operates tanker vessels that are capable of transporting refined petroleum products such as naphtha, gasoline, jet fuel, kerosene, diesel, and fuel oil. The company was founded by Valentios Valentis on March 23, 2015 and is headquartered in Athens, Greece.
P/E Current
-3.72
P/E Ratio (with extraordinary items)
-2.68
Average Recommendation: BUY
Average Target Price: 2.00
BVSN - Huge Buying Momentum - Good YTDBroadVision, Inc. engages in the provision of electronic commerce business solutions. It offers products under the brand name of Clearvale, Vmoso, and BroadVision9. The company was founded by Pehong Chen in May 1993 and is headquartered in Redwood City, CA.
SHORT INTEREST
7.16K 09/13/19
P/E Current
-1.32
P/E Ratio (with extraordinary items)
-2.37
Average Recommendation: SELL Average Target Price: 21.00

SPY is going higher. Regardless of what anyone thinks!!Thanks to all of my followers. I appreciate all of you!
My first video on YouTube youtu.be
Or just YouTube search for Dumb Money Trader. No laughing, it was my first video!!


ES with no clear pictureAfter our big friday drop from china news. We still held our 13d ema and has small bounce up from it. Still bearish back down to our previous wedge but could go either way looking at charts. Def need to keep eye on this sunday night!

Dash - Could Go On A Run HereDash for the first time in a long time is above the MA's and showing a bullish trend. If BTC behaves it could carry on and retrace some of the moves.

LBY - MA200 Daily Retest Coming - Risky But Reward HighLibbey, Inc. manufactures and markets glass tableware products. It engages in design and sale of tableware and other products. The company also source glass tableware, ceramic dinnerware, metal flatware, and hollowware and serveware products. Its brands include Libbey, Libbey Signature, Masters Reserve, World Tableware, Syracuse China, Crisa Royal Leerdam and Crisal Glass. The company was founded in 1888 and is headquartered in Toledo, OH.
SHORT INTEREST
2.84M 08/30/19
P/E Current
-7.64
P/E Ratio (with extraordinary items)
-1.07
Average Recommendation: BUY
Average Target Price: 7.00
