Gold at Key Resistance: Short Opportunity Before Breakout?Based on my chart, I’m analyzing XAU/USD (Gold) on the multi-timeframe, with key levels and trendlines marked. Here’s a potential trade idea derived from this technical setup:
Trade Idea:
• What: Short sell (SELL) Gold (XAU/USD) around 2,734–2,735 zone.
• Why:
• Price Action Resistance: The price is nearing a strong resistance area around 2,735–. 2,740, indicated by the horizontal orange and red lines. These levels have acted as significant selling zones in the past, which could cause a reversal.
• MSS (Market Structure Shift): There’s a shift in the market structure (MSS) slightly below, indicating a possible breakdown of bullish momentum after the recent uptrend.
• Ascending Trendline: The price is currently respecting an ascending trendline (in purple), but if it breaks this support level, it could trigger more downside.
• Fibonacci/Support Levels: The levels 2,730.46, 2,723.67, and 2,714.22 (orange and red lines) represent possible key retracement or support points where price could fall to if resistance holds.
How:
• Entry: Enter a short position near the current price of 2,734–2,735.
• Stop Loss: Place your stop-loss above the resistance at 2,741 to protect against further upward movement if price breaks above this zone.
• Take Profit: Target support zones at 2,730.46 (first target) and 2,723.67 (second target) for potential profit taking.
Risk Management:
• Ensure you manage position size to risk no more than 1–2% of your account per trade.
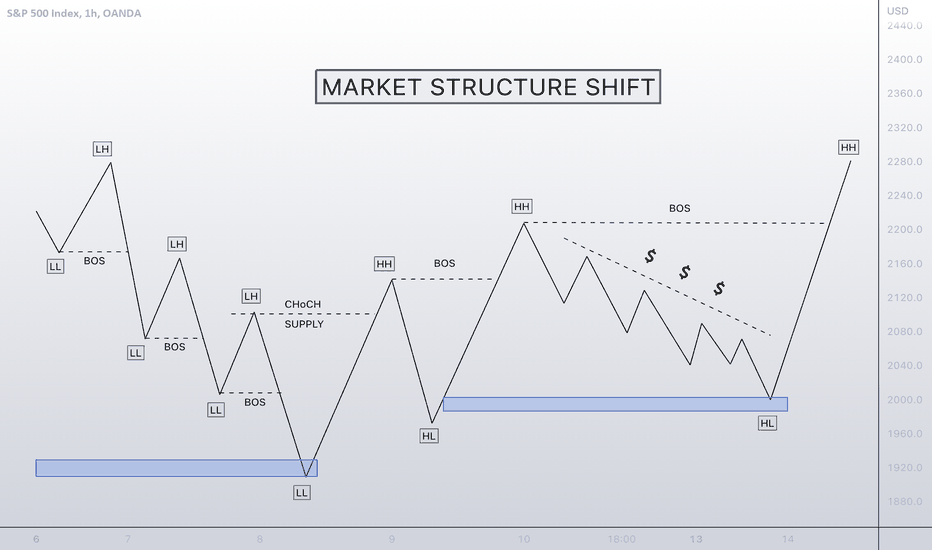
Marketshift
🤓 🤓 MARKET STRUCTURE SHIFT! SMCMarket structure in Forex trading or price action is how many people take advantage of the markets. No indicators, and no volume. Because the market does not have a centralised exchange. Forex traders often swing trade the market based on the structure to take advantage of the opportunity.
Structural market change is broadly defined as a shift or change in the way in which a market or economy functions or operates.
I have tried my best to show you in the easiest possible way to look out for. Save this to your notes for future reference.
Emini S&P 500 (ESH2022) *Prediction*Thursday Feb 17 (2022) (4H TF)
I’m Anticipating that price will sweep the Low For Sell Side Liquidity and possibly Perform an ICT Market shift Model that can give me a Long Position Targeting the Intermediate highs and possibly Filling Redelivered Rebalance with Final TP being Equal highs/ Buy Stops at Top. Will Update The before Entry and After Entry soon....
UK100 H4Identifying a reversal, we have 2 patterns here. First the double top that occured as price failed to break the all time high, along with a breakout of the rising channel. Watching the lower timeframe for slight retracements & a bearish continuation.


