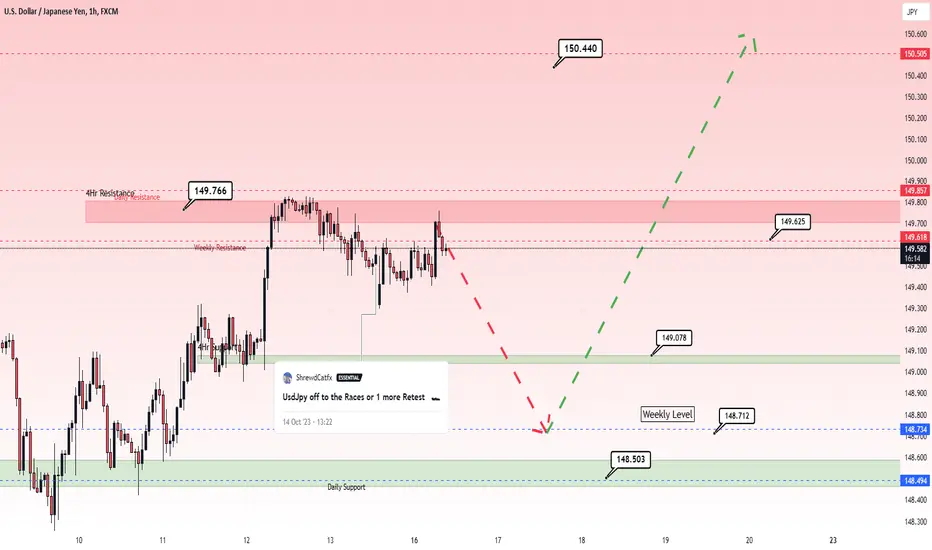
Too Early in week UsdJpy? 🚦UsdJpy , the Yen is testing the highs for liquidity preceding a decrease. It is early in the week and probabilities are not there for the kind of upside volume that we want to observe .
150.5 Bullish Weekly target
152 2nd Bullish Weekly Target
148.71 Bearish Weekly target
148.23 Bearish weekly target #2
Marketstructure
AUDCAD - Wait Like a Sniper 🛡Hello TradingView Family / Fellow Traders. This is Richard, also known as theSignalyst.
AUDCAD has been overall bearish trading inside the falling wedge pattern in red, and it is currently approaching around the upper of the wedge / upper red trendline.
Moreover, the zone 0.885 - 0.89 is a strong resistance.
🏹 So the highlighted red circle is a strong area to look for sell setups as it is the intersection of the green resistance and upper red trendline acting as a non-horizontal resistance.
As per my trading style:
As AUDNZD approaches the red circle zone, I will be looking for bearish reversal setups (like a double top pattern, trendline break , and so on...)
📚 Always follow your trading plan regarding entry, risk management, and trade management.
Good luck!
All Strategies Are Good; If Managed Properly!
~Rich

#DXY more bullish outlookHello, everyone. I hope you're all having a great week.
Let's analyze the DXY chart and try to make some predictions for the upcoming week.
Last week, the price was rejected from the important low indicated on the chart and also established a new 4-hour high, as evident in the chart. Consequently, the market structure in the 4-hour time frame is now in alignment with the higher time frame, daily market structure, and they both exhibit a bullish trend.
Given this scenario, our primary interest lies in taking long positions in high-probability trading zones. These zones could be around the short-term low marked with an arrow or during a pullback to the broken short-term bearish trendline.
In the meantime, as we await the price to reach these levels, we will closely monitor the market. Once the price approaches these areas, we will be looking for confirmation signals before considering our trades.

MASTERING MARKET STRUCTURE : BOS, CHOCHBreak of Structure: This term is used in trading and technical analysis to describe a significant change in the price action of an asset. It occurs when the established pattern of higher highs and higher lows (in an uptrend) or lower highs and lower lows (in a downtrend) is disrupted, indicating a potential change in market sentiment and trend direction.
Examples of Break of Structure: You can find examples of "break of structure" in both bullish and bearish movements. In a bullish scenario, a "break of structure" occurs when a new Higher High (HH) is formed, surpassing the previous High (H). In a bearish context, it happens when the price forms a new Lower Low (LL) below the previous Low (L), indicating a potential shift in market sentiment and trend direction.
Shift in Structure : Sometimes, a "break of structure" leads to a more profound change in market character, referred to as a "Shift in Structure." This often involves a transition from a bullish to a bearish trend or vice versa.
Change of Character (CHOCH): The first instance of a significant shift in market sentiment and trend direction is termed "Change of Character" (CHOCH). This emphasizes the unique nature of the initial change.
Break of Structure (BOS): Subsequent occurrences of a similar shift in market sentiment are labeled as "Breaks of Structure" (BOS). These serve to differentiate the first significant change from those that follow.
These concepts are vital in trading and technical analysis as they help traders identify changes in market sentiment, adapt to evolving trends, and make informed trading decisions. Recognizing a "break of structure" and understanding when it leads to a "shift in structure" is essential for effective trading.

#DXY Possible scenarioHello, traders. Let's take a look at the DXY chart and discuss the possible movements of this chart for the next couple of days.
As we know, the price recently broke below an important bullish channel for the first time since July 4th when this major bullish run began.
However, as you can see, it failed to break below the previous low, which has been identified as an important support level. Based on Dow theory, the bullish trend is still intact since we have not violated the most recent lower low.
So, we currently have two conflicting signals. One is bearish due to the breakdown of the long-term bullish channel, while the other is bullish because the price hasn't breached the last low.
Furthermore, following the rejection of the low, the price moved higher impulsively, suggesting that buyers are still active. This is another bullish indication. However, the formation of a descending triangle chart pattern, which is bearish in nature, provides a mixed signal.
For trading and as a personal opinion, the current price area may not be the best entry point into the market. Additionally, any upside breakout of the triangle chart pattern could potentially be a false breakout and may not be an optimal trading opportunity. However, if the price retraces lower to test the previous low and fails to break below it, we might consider taking a long position on the US dollar.
If you've found this analysis helpful, please take a moment to like, comment, or share your thoughts with me.

Mastering Market StructureBullish Market Structure:
Bullish Vibes! It's all about making Higher Highs and Higher Lows. When you spot this pattern, you're riding the wave of optimism in the market, and it's your chance to seize the moment and soar with the bulls.
Consolidation Market Structure:
Consolidation Market Structure is all about lateral movement, where the market forms Equal Highs and Equal Lows. It's a phase of uncertainty, with neither bulls nor bears holding a clear advantage. Traders often await a breakout to determine the next market direction.
Bearish Market Structure:
Bearish Market Structure: Get ready for Lower Highs and Lower Lows. Sellers are in control, creating a solid downtrend. Traders look for short entry opportunities on retracements.

I think from now Indian market is going to 🚀 shoot up The Indian market is showing signs of a strong recovery after a period of volatility and uncertainty. This is just my analysis its not any type of call

#Banknifty Trading Near Important Support ZoneOn Daily Timeframe, BANKNIFTY trading at important support zone. Time to wait for either breakdown or reversal for the Banknifty.
Case 1: Consolidation Move
- Banknifty can consolidate near this support level before the strong movement
- Consolidation zone is nearly 500 points from 44000 to 44500 level
Case 2: Breakdown Move
- Confirmation for breakdown will be if Banknifty starts trading and sustain below 43500 level
- Downside rally nearly 2500+ points expected in case of breakdown
- Intermediate support expected near 42500 level
- Short Trader can place there stop loss if banknifty starts trading above 44550 level
Case 3: Long Side Move
- Long side movement expected in case banknifty starts trading and sustain above 44550 level
- Above this level banknifty can go upto the 46400-46500+ level.
- Intermediate resistance expected near 45500 level
- Long trader can place there stop loss if banknifty starts trading below 43500 level.
To be continue. We will keep posting next update in comment section....

NZDJPY - Following The Trend ↗️Hello TradingView Family / Fellow Traders. This is Richard, also known as theSignalyst.
on Daily: Left Chart
NZDJPY has been overall bullish trading inside that big wedge pattern; and it is currently retesting the lower bound / orange trendline.
on H1: Right Chart
For the bulls to take over, and activate our buy setup, we need a break above the last high in gray.
Meanwhile, NZDJPY would be bearish and can still trade lower, especially if the 87.0 daily low is broken downward.
📚 Always follow your trading plan regarding entry, risk management, and trade management.
Good luck!
All Strategies Are Good; If Managed Properly!
~Rich

#OIL buying opportunityConsidering the recent bullish momentum in the oil market, characterized by a clear market structure of establishing higher highs and higher lows while respecting to a short-term bullish channel, we anticipate that oil prices will rise from their current low, as depicted on the chart.
In addition to the bullish channel, there are other bullish indicators on the chart. Notably, the 1-hour 200EMA (Exponential Moving Average) has consistently provided strong support during this recent bullish phase. Every time the price has approached this EMA, it has turned upwards.
Furthermore, the current price level is situated within a 4-hour demand area, which further enhances the possibility of a bullish movement.
If you've found this analysis helpful, please take a moment to like, comment, or share your thoughts with me.

#AUDNZD selling opportunity
Hello, dear traders and colleagues. I wish you all a successful trading week.
Let's examine the AUDNZD chart to identify a potential selling opportunity.
As you can observe, the price is currently testing the upper boundary of a bearish channel, which has been acting as a resistance following an extended rally. Recent price movements in the past two days show signs of exhaustion, further increasing the likelihood of a bearish move.
Additionally, by examining the daily candlestick, you'll notice that we've experienced upside rejections in the last two days, indicating the presence of selling pressure.
To initiate a sell position on this pair, we would prefer to witness another upward movement, aimed at clearing liquidity from above the horizontal arrow we've marked on the chart. Subsequently, we'll look for a break below the short-term bullish trendline that has kept the price elevated during the recent bullish movement.

#GBPCAD selling opportunityHello, traders and friends.
Let's analyze the GBPCAD chart, where we believe there might be a compelling selling opportunity.
In the Daily timeframe, you can see that the price has already broken the market structure to the downside. Since the low formed on September 28th, we've been in what we believe is a bullish corrective phase. Consequently, we are now interested in a selling position.
Switching to the 4-hour timeframe, we notice a double top formation that resulted in a lower low, indicating the possibility of bearish continuation, aligning with our higher time frame daily trend. Following this, the price has been moving upwards in a bullish corrective manner, forming a short-term rising channel. Last week, this channel also broke to the downside.
In our view, this recent bullish movement resembles a liquidity-taking activity, and we are keen to observe any rejections from the level marked by the arrow on the chart, with the intent to consider selling.
Additionally, we have identified several resistance factors within a small zone, including the 4-hour and daily timeframe 200EMA, a supply area in the 4-hour timeframe, and the previous high where many traders have placed their stop-loss orders just above it. This presents an opportunity for banks to potentially extract liquidity.
If you have found this analysis helpful, please take a moment to leave a like and a comment or share your idea with me.

Gold PutsSeems like price just completed the 5th wave just below the resistance area. And if thats the case then we will be seeing a continuation to A, B and C legs to fully complete this wave and start a new one.

Textbook bull trapThis is a well-known bull trap that whales use to earn money.
1st phase:
They pump price hard, a big candle appears and people FOMO in.
2nd phase:
They sell with benefits and people FUD, making price crash.
Down there, whales accumulate again before pumping price again.
3rd phase:
The 1st phase is repeated, they sell again up there with benefits and let it crash again so people sell everything and repeat in some days/weeks/months.
It's during the 3rd phase that some people don't sell thinking that it will keep pushing up but it doesn't, making them sell at a huge loss, crashing price even harder. This bull trap is the beginning of a big crash. Get ready.
*Not financial advice.

EURUSD SHORTI took short position yesterday and I will add more.
I am waiting market structure shift and if it happens I am gonna short more.
I am focusing Equal Lows and Sell side levels which is I draw on!
Manage your risks and happy trading!
Follow and like idea )

#Oil buying opportunityHello dear traders and friends, I hope you are all having a great week. Let's take a look at Crude Oil prices, where it appears that the price has formed a support level around $80 to $82 after a 14% bearish move since the top formed in late September.
In the 4-hour timeframe, we can observe that the price has already shifted its bearish market structure to the upside by forming a new high. What's particularly noteworthy is that this high was formed from a higher low, indicating that sellers were unable to push prices any lower despite the prevailing bearish trend.
In the daily timeframe, things become even more interesting as the price has formed a significant bullish engulfing candle that has covered the last four daily candles. This suggests a high potential for upward movement. Additionally, in the 1-hour timeframe, we can see that the price is near a static support area, as indicated on the chart, and coincides with the daily central pivot area. This further supports the possibility of this area acting as a price low.
Apart from the technical aspects, we are also aware of the ongoing tensions in the Middle East between Israel and Hamas. The potential escalation of conflict and involvement of other countries can have a positive impact on oil prices.
Please also take a look at my other posted ideas which I'm sure you are going to like it and share your thoughts and feedback with me. Thank you.

Expect to climb to the desired goalAfter a sharp move, the price corrected
And in the lower time frame, we see the end of the price correction and rotation
At the indicated place, I expect the price to move to the previous week's ceiling

Gbp/Nzd Buy SetupWe are seeing in Daily timeframe price action is still in overall uptrend
==> Price in H4 and H1 is retesting the support area and also price is forming a double bottom
==> Price action is now retraced after breaking the neckline of the double bottom which give it a nice risk to reward setup for a continuation based on the range of the double bottom length
Follow me for more breakdown like this

Eur/jpy Buy setup 230 PipsWe are seeing aggressive buying power as market structure is still maintaining to upside
==> Daily timeframe price action is above the EMA's and we see wonderful rejection in the area of liquidity as support zone
==> Price is now bounding between to upper and lower limit of the accumulation zone, now come confirmation of buy after a fakeout at the bottom for a continuation to upside
==> Nice risk to reward but keep an eye on the upper bound limit for rejection that can invalidate the setup
Follow me for more breakdown

Eur/Aud Buy setupNice head and shoulder formation in H4 timeframe,
==> price has retraced to retest the previous resistance as support,
==> Also price is respecting the 38.2% fib level so we could see a massive move to upside
==> nice risk to reward setup

BTC - Critical Resistance ❗️Greetings, TradingView Family! This is Richard, also known as theSignalyst.
BTC is currently hovering around a strong resistance zone and round number 28,000.
📈 For the bulls to remain in control, we need a break above 28,500.
In this case, a bullish continuation till the 30,000 - 32,000 weekly resistance would be expected.
📉 Meanwhile, the bears can still kick in short-term and push lower till the lower bound of the red rising broadening wedge pattern.
However, the bulls would remain in control medium-term as long as the lower red trendline holds.
Which scenario do you think is more likely to happen? and why?
📚 Always remember to follow your trading plan when it comes to entry, risk management, and trade management.
Good luck!
Remember, all strategies are good if managed properly!
~Rich

EURUSD Waiting for the opportunity to sell downAt the beginning of the trading session on October 17 (Vietnam time), on the world market, the USD Index (DXY), a measure of the strength of the greenback compared to other major currencies, was at 106.21 points. , down 0.41% compared to the closing session on October 16. Meanwhile, the Euro increased 0.40%, reaching 1.0554 USD.
The dollar steadied against the Japanese yen at 149.55 - close to the key 150 level. Some traders see the possibility of Japanese authorities intervening to support the currency's rebound. Last weekend, Japan's top currency diplomat Masato Kanda said the authorities would take appropriate action in the context of excessive fluctuations in the yen./.

BTC may decrease todayBitcoin immediately rebounded to $30,000 after rumors emerged that the SEC had approved Blackrock/iShares' BTC spot ETF.
However, the price of the flagship asset quickly returned to around $28,000 after Blackrock denied this, saying its application was still under review.
CoinGlass data shows that short positions worth about $81 million were liquidated when BTC hit $30,000, and long positions worth $31 million evaporated during the correction.
