The Power of Candlestick Encapsulation in Trading: Utilizing theTrading is a captivating and intricate field that demands a profound understanding of financial markets, investment strategies, and technical analysis. Among the many techniques employed by traders, candlestick encapsulation is one that can prove to be particularly powerful. In this article, we will explore the concept of candlestick encapsulation and how one can harness the 50% of the first candle's length as a potential support or resistance level.
What Is Candlestick Encapsulation?
Candlestick encapsulation, also known as an "inside bar," is a price pattern that occurs when a subsequent candle develops within the boundaries of the preceding candle. In other words, the price range of the second candle is entirely contained within the range of the first candle. This pattern can appear on any time frame, from daily candles to one-minute candles, and is often used by traders to identify potential turning points in the markets.
How to Identify Candlestick Encapsulation?
To identify candlestick encapsulation, follow these steps:
* Examine the First Candle: Begin by observing the most recent candle on your price chart. This will be the "mother candle."
* Take a Look at the Next Candle: Next, examine the candle that follows the mother candle. This candle should have a price range that is completely contained within the range of the mother candle.
* Confirm the Pattern: To confirm candlestick encapsulation, the second candle must close within the range of the mother candle.
Using the 50% Level as Support or Resistance
Now that we understand what candlestick encapsulation is, let's explore how to leverage the 50% of the first candle's length as a potential support or resistance level.
* Calculate the Length of the First Candle: Measure the length of the mother candle from its high to its low.
* Calculate 50% of the Length: Now, calculate exactly 50% of this length. You can do this by adding the high and low of the mother candle and dividing by two.
* Draw the Horizontal Line: Plot a horizontal line on your price chart at the level you calculated as 50% of the mother candle's length.
* Observe Price Behavior: This horizontal line represents a potential support level if prices move below it or a resistance level if prices stay above it. Observe how prices react when they reach this level.
Interpretation and Strategy
The use of the 50% level of the mother candle's length as support or resistance can be applied in various trading strategies. Here are some important considerations:
* Breakout Strategy: If prices break above the 50% level, there may be a potential bullish breakout. In this case, traders may look for buying opportunities.
* Pullback Strategy: If prices return to the 50% level after a breakout, this could be an opportunity to enter positions in the direction of the prevailing trend.
* Stop Loss and Take Profit: Traders can use the 50% level as a reference point to place stop-loss or take-profit orders.
Conclusion
Candlestick encapsulation is a technical analysis technique that can provide valuable insights into potential turning points in financial markets. By using the 50% level of the mother candle's length as support or resistance, traders can add another tool to their trading toolkit for making informed trading decisions. However, it is important to remember that no technique is foolproof, and trading always involves a degree of risk. Therefore, it is advisable to combine this technique with careful risk management and a solid understanding of financial markets.
Marketstructure

How To Analyze Any Chart 📚📹Hello TradingView Family / Fellow Traders. This is Richard, also known as theSignalyst.
Today we are going to go over a practical example on #JNJ , but you can apply the same logic / strategy on any instrument.
Feel free to ask questions or request any instrument for the next episode.
📚 Always remember to follow your trading plan when it comes to entry, risk management, and trade management.
Good luck!
Remember, all strategies are good if managed properly!
~Rich

EURUSD..Continuous Down 📉Hello guys. My Idea on EURUSD is That we Continue on a Bearish Movement to the Downside Aligning With the Overall Daily and H4 bearish Structure. Trade Safe.. Comment What you see too ....James ❤

GBP/CAD Short Opportunity - SeptemberExplanation within the chart - entry could have been better. Going for a 2RR

#CHFJPY bullish continuation*please be sure to remember that today we have FOMC meeting and they are going to announce funds rate and their policies for coming meetings with a high possibility of a lot of movement in all pairs.
As you can see in the chart price broke above short-term bearish trendline with strong 4H time frame Marubozu like candlestick which revels buyers strength.
This bearish move since the completion of 4H time frame candle can be interpreted as pullback to test the broken trendline and its possible to be looking to buy in this area.

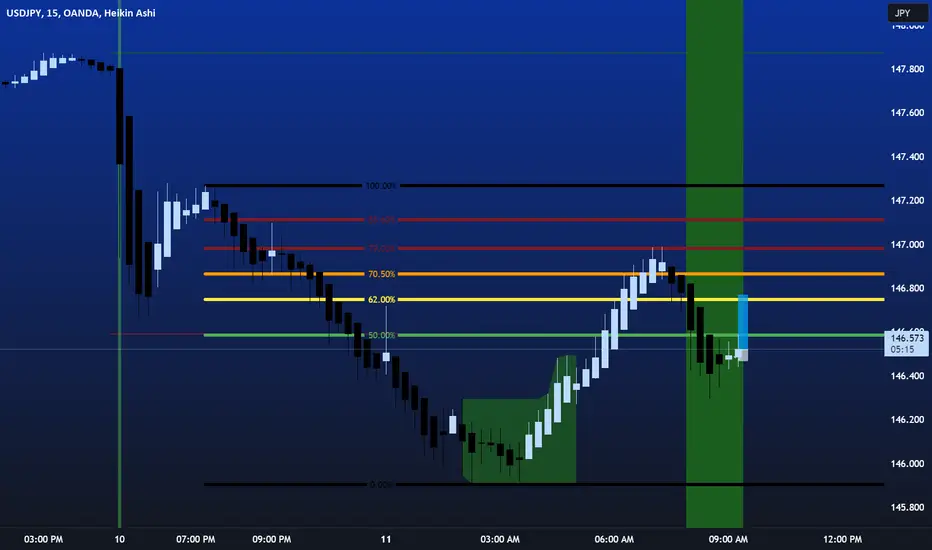
USD/JPY Short Opportunity - September Market structure was clean, clean traffic to the left. Every rule / confluence was met - great RR and great RT to EMA on HTF and entered TF - however took a chance on price action as the entered bearish engulf was 50% body & wick.....then trade is invalid !!

EUR/AUD Short Opportunity - SeptemberExplanation is in the chart - price made a higher high, was looking for a re-test on previous resistance turned support. Price created bullish engulfing candle & EMA RT - my entry was off by 5 pips, should be BE but took a 0.5% L

GBPCAD SHORT - STRONG BEARISH MOMENTUM!Waiting for a retest of 1.68792 to short GBPCAD back to Daily swing lows at 1.66195
If you agree drop a like and if you have any questions leave a comment :)

EURCAD SHORT - RETRACEMENT NEEDED!Waiting for a retest of 1.44263 or 1.45128 to short EURCAD back to Daily swing lows at 1.42981
If you agree drop a like and if you have any questions leave a comment :)

Advanced Analysic for GBPAUD! BUY HERE!My analysis of the GBPAUD forex pair is as follows:
Market Structure: I have identified the MINOR wave structure, marked in BLUE on the chart. The corrective wave structure, labeled 0A-BC and marked in RED, is also evident. By employing additional techniques, I anticipate that the correction will conclude at the designated point C.
Price Action Momentum Channel: On the chart, I've identified a bearish momentum channel. I anticipate that the price will reach the lower boundary of this channel, and this could present an opportunity for buyers to enter the market.
Fibonacci Analysis: I've identified significant price reaction zones using Fibonacci analysis. In conjunction with other analytical methods, I predict that the price will react notably at two critical levels, particularly in the presence of substantial economic news.
SUPPLY & DEMAND BLUE MINOR STRUCTURE: ~ Fibonacci 0.618 reversal.
Other Secrect analysic.
Thank you for considering this analysis.

EUR/CAD Short Opportunity - September Good market structure play, price was creating LLs and LHs - entered on the RT and new LH after bearish engulf & RT towards EMA - looking for continuation to the downside with 2 RR

EUR/JPY Short OpportunityA+ Setup !! combination of both my plays - RT with broken support zone and a 38.2% RT !

GBP/USD Short OpportunityGood setup - price created LL and LH - entered on the 1st LH, price broke previous low but ended up triggering SL at BE

USD/JPY Long Opportunity - September Really good setup = A+ but SL was triggered BE
Price made HHs and HLs - good engulfing 30min candle showing upward momentum.

Intuitive Mode!King W. Harbmayg's Journal Entry #33
Lesser Position— 1:5 R
Scheme 1— Thesis via 15M
a. who is currently in control of the market?
buyers
b. is the market currently in its pump phase?
yes
________________________________
Scheme 2— Execution via 1M
a. is the market at a significant price level?
yes
b. execute.
GBPCAD SHORT - HIGH PROBABILITY SETUP!Waiting for a retest of 1.71156 to short GBPCAD back to swing lows at 1.68793
If you agree drop a like and if you have any questions leave a comment :)

EURCAD SHORT - MORE DOWNSIDE TO FOLLOW!Waiting for a retest of 1.46278 to short EURCAD back to swing lows at 1.44906
If you agree drop a like and if you have any questions leave a comment :)

EUR/CAD Long Opportunity - August RecapThis was a H1 trade - compromised on the traffic rule where there was 2 red candles....rule is x1 but entered candle was above...otherwise the setup was not too bad 6/10

XAU/USD Short Opportunity - August RecapNot the greatest play in terms of market structure, price was consolidating on the HTF and the candle that was entered was 50% wick & body.....BE was respected x2 and then SL was triggered...1% loss

EUR/USD Short Opportunity - August RecapThis was an A+ setup - needed to monitor RT on the HTF as price was above but was a form of extended RT as price continued downwards, price was initially underneath on HTF - it RT previous broken support zone and there was clean traffic for downward momentum after RT on both EMAs

XAUUSD SELL HERE!Advanced Technical Analysic for maxximum Precision for symbol XAUUSD!
1. Market Structrure, Wave Structure.
2. Trend & Reversal.
3. Supply & Demand zone.
4. Fibonacci analysic.
5. Indicator, Volume, Candlestricks.
6. Secret Technical Analysic.

NQ1! 100 E-mini Futures 1HNQ1! 100 E-mini Futures 1H
Signals:
1. Market structure : Higher High, Higher Low.
2. Mommentum channel PULLISH.
3. Indicator: RSI - hidden divergence RSI
4. Gap

EURUSD. Advanced technical analysic!My strategy - Advance technical analysic for once timeframe:
1. Marketstructure, Wave structure.
2. Price action, Trend & Reversal.
3. Supply & Demand.
4. Fibonacci analysic.
5. Candlestricks, Volume histogram.
6. Indicator.
