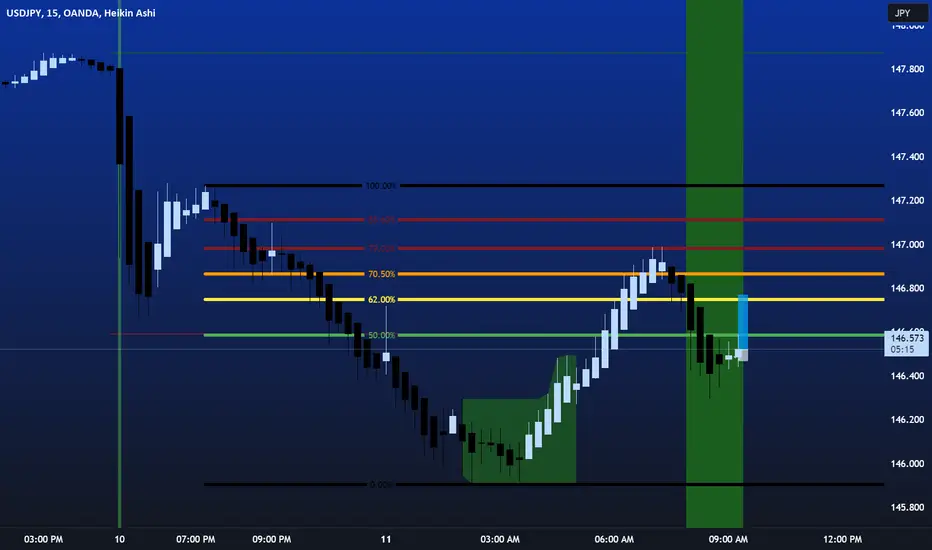
USD/JPY Long Opportunity - September Really good setup = A+ but SL was triggered BE
Price made HHs and HLs - good engulfing 30min candle showing upward momentum.
Marketstructure

Intuitive Mode!King W. Harbmayg's Journal Entry #33
Lesser Position— 1:5 R
Scheme 1— Thesis via 15M
a. who is currently in control of the market?
buyers
b. is the market currently in its pump phase?
yes
________________________________
Scheme 2— Execution via 1M
a. is the market at a significant price level?
yes
b. execute.
GBPCAD SHORT - HIGH PROBABILITY SETUP!Waiting for a retest of 1.71156 to short GBPCAD back to swing lows at 1.68793
If you agree drop a like and if you have any questions leave a comment :)

EURCAD SHORT - MORE DOWNSIDE TO FOLLOW!Waiting for a retest of 1.46278 to short EURCAD back to swing lows at 1.44906
If you agree drop a like and if you have any questions leave a comment :)

EUR/CAD Long Opportunity - August RecapThis was a H1 trade - compromised on the traffic rule where there was 2 red candles....rule is x1 but entered candle was above...otherwise the setup was not too bad 6/10

XAU/USD Short Opportunity - August RecapNot the greatest play in terms of market structure, price was consolidating on the HTF and the candle that was entered was 50% wick & body.....BE was respected x2 and then SL was triggered...1% loss

EUR/USD Short Opportunity - August RecapThis was an A+ setup - needed to monitor RT on the HTF as price was above but was a form of extended RT as price continued downwards, price was initially underneath on HTF - it RT previous broken support zone and there was clean traffic for downward momentum after RT on both EMAs

XAUUSD SELL HERE!Advanced Technical Analysic for maxximum Precision for symbol XAUUSD!
1. Market Structrure, Wave Structure.
2. Trend & Reversal.
3. Supply & Demand zone.
4. Fibonacci analysic.
5. Indicator, Volume, Candlestricks.
6. Secret Technical Analysic.

NQ1! 100 E-mini Futures 1HNQ1! 100 E-mini Futures 1H
Signals:
1. Market structure : Higher High, Higher Low.
2. Mommentum channel PULLISH.
3. Indicator: RSI - hidden divergence RSI
4. Gap

EURUSD. Advanced technical analysic!My strategy - Advance technical analysic for once timeframe:
1. Marketstructure, Wave structure.
2. Price action, Trend & Reversal.
3. Supply & Demand.
4. Fibonacci analysic.
5. Candlestricks, Volume histogram.
6. Indicator.

EUR/USD Short Opportunity - August RecapA+ setup - clean M.S, engulfing bearish candle showing downward momentum, clean RT on EMA & on the HTF. Easy 2RR

Disney Macro Looks Dire with Risk of Further 40% DeclinesHi guys! So this is a Pure Technical Analysis on the Macro structure of Disney (DIS).
Macro in that we are on the 1 Month timeframe so each candle is 1 Months worth of price action averaged in.
Just note why i don't ever look at news to influence my trades. We got rejected from our highs in October 2021, Desantos bill signing that sparked the lawsuit stuff happened June 2022.
Prices were already on the decline way before. Just saying. Anyway moving on.
What i want to point out is our current price action.
We are currently BELOW the Major SUPPORT LINE that played support for about 7-8 years.
Being a monthly timeframe, just note we have NOT yet confirmed as our current candle is ongoing.
Ideally We would need to get back ABOVE and confirm Support to prevent further declines.
BUT if we do confirm here its NOT a good look.
BELOW the "The Last SUPPORT Line of Defence" is even way worse.
If we end of Confirming Resistance Below "the Last Line of Defence", we risk almost 44% Price DECLINES back to the highs of a previous consolidation zone or the line labeled "Major Support".
Its because the Rapid Price Increase labeled "Weak Market Structure" has no distinctive/ strong Support zones.
Theres nothing to cushion the eminent Price Declines that may be awaiting us.
Its mainly because we didnt test SUPPORT and have a slow methodical rise in price.
We also recently printed a DEATH CROSS. By the looks of that monster mouth, its a long ways before its momentum fizzles out.
If VOLUME also continues to be on the rise while we have this DEATH CROSS and price declines, aspect more price declines.
And the likely scenario of the DECLINE to "Major Support".
Keep in the back of the mind: This could make for a solid SHORT play once that confirmation below the last line of defence happens.
Anyway look to smaller timeframes for more current price action to see how things shape up for the macro. Keep on the look out for updates in the hourly, daily or weekly timeframes.
__________________________________________________________________________________
Thank you for taking the time to read my analysis. Hope it helped keep you informed. Please do support my ideas by boosting, following me and commenting. Thanks again.
Stay tuned for more updates on DIS in smaller timeframes in the near future.
If you have any questions, do reach out. Thank you again.
DISCLAIMER: This is not financial advice, i am not a financial advisor. The thoughts expressed in the posts are my opinion and for educational purposes. Do not use my ideas for the basis of your trading strategy, make sure to work out your own strategy and when trading always spend majority of your time on risk management strategy.

GBP.CAD Advanced Technical AnalysisAdvanced Technical Analysis for Maximum Precision with symbol GBPCAD.
1. Price action
2. Trend & Reversal
3. Indicators & volume & Candlestricks
4. Fibonacci
5. Market structure.

Advanced Technical Analysis for GPBUSDAdvanced Technical Analysis for Maximum Precision GBPUSD
1. Markets structure
2. Waves Structure
3. Fibonacci
4. Trendline and reversal
5. Indicator, Volume, Candlestricks

GBP/USD Short Opportunity - August RecapGreat play, price created support then broke that support and turned resistance. Clean RT towards the zone and bearish engulfing candle with a wick-fill. SL was managed accordingly being above the EMA and previous candle - great 2RR trade

GBP/USD Long Opportunity - August RecapNot the cleanest of setups but managed to BE on this trade - M.S was not the best but RT and P.A was valid with HTF RT

EUR/JPY Long Opportunity - August Recapwaited for bullish confirmation - there was flexibility on the clean traffic to the left but once bull candle closed, there was clean traffic, only underneath multiple red candles in uptrend - good setup over all!

USD/JPY Long Opportunity - August RecapTrade was very good - clean M.S and P.A, HOWEVER, price did not hit EMA on the HTF - great RT and 2.5RR

Potential Bullish move continuationAs it is clear in the chart price has tested 1H Clean Break area acting as Support for the second time in the form of #double_bottom formation and also formed a bullish standard divergence which add to possibility of bullish move.
Also in 4H time frame price only took out liquidity from the previous low and failed to close below as you can see the arrow line and price failure to close below.

EURUSD SHORT - STRONG BEARISH MOMENTUM!Waiting for a retest of 1.08293 to short EURUSD back to Daily swing lows at 1.06882
If you agree drop a like and if you have any questions leave a comment :)

CADJPY LONG - AWATING BREAK OF RESISTANCE!Waiting for a retest of 108.216 to long CADJPY back to swing highs at 109.254
If you agree drop a like and if you have any questions leave a comment :)

GBPCAD SHORT - BIG MOVE NEXT!Waiting for a retest of 1.70807 to short GBPCAD back to swing lows at 1.68772
If you agree drop a like and if you have any questions leave a comment :)

TATA STEEL LTD - 40% ROI - Long TermSYMMETRICAL TRIANGLE in Weekly Time Frame
if this stock breaks 115 level, huge potential comes in this stock
If you are interested in investment, go for it with proper risk.
Overall "TATA STEEL" fundamentally good stock.
Entry level : 115
SL : 102
TARGETS : 125,138,152
Disclaimer - All information on this page is for educational purposes only,
we are not SEBI Registered, Please consult a SEBI registered financial advisor for your financial matters before investing And taking any decision. We are not responsible for any profit/loss you made.
HAPPY TRADING GUYS
