BANK NIFTY - ALL TARGETS DONE - 04/07/2023HELLO TRADERS
How was todays market
Today we have seen False BreakDown at the morning time
but that break down was fails in retest and again it comes back to Up movement and reached all targets perfectly
Are you happy with my nifty targets
How many Traders received this profits today
please Comment below in the Comment Box
I need all your Responses, Then only i will give more accurate Strategies daily with your support
Marketstructure

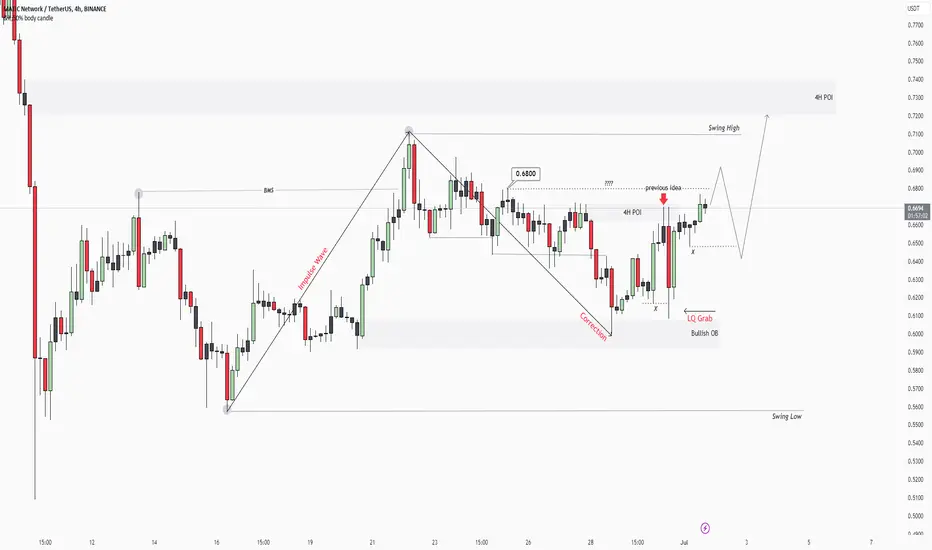
Matic/Usdt Update Hello traders
In the previous post, the matic shared an opportunity to sell at 4H POI
Indeed, the price fell from it, but extracted the liquidity and continued to rise
Now, if it breaks 0.6800 with the body of a candle, we will look for buying opportunities to target the Swing High
EURNZD LONG - WAITING FOR RETEST!Waiting for a retest of 1.66299 to long EURNZD back to Daily highs at 1.80425
If you agree drop a like and if you have any questions leave a comment :)

NZDUSD SHORT - STRONG AREA OF CONFLUENCE!Waiting for a retest of 0.61356 to short NZDUSD back to Daily swing lows at 0.59916
If you agree drop a like and if you have any questions leave a comment :)

SPY Analysis SPY 65m: An acute SPY study shared with peers was used to example the weekly movement of SPY. SPY vs ES was used as a benchmark for S&P Cash Index due to intraday activity (as of recent). Using the 65m horizon, key inflection points were identified using market structure and regression analysis.
Session highs for the index ending the week and quarter and marking a new yearly high with current price for SPY trading at 443.28 at the end of session. With July historically associated as a risk on period for the market, longer term bias for neutral-bullish remains (please seek 6WK study for ES1).
Forward looking (on acute horizon), fibonacci analysis was applied to current structure being developed during price rediscovery and confidence of character being developed where key levels are: 444.30 (HOD), 443.99, 443.62, *443.09*, *442.71*, 441.91, 441.11
*Prices of higher interest using fibonacci application
Bias: Neutral to risk on
ATR: 4.27
Price at time of publish: 443.28 (amc)

AUD/USD Downtrend 📉Price is still trending down. We can see lower highs and lower lows formation. It is possible to see new lower high followed with a move down.

📚 Bow & Arrow Pattern 🏹Hello TradingView Family / Fellow Traders. This is Richard, also known as theSignalyst.
Today, I want to share an interesting pattern that I always use to speculate (to an extent) the next move of an asset.
🏹 I call it the "Bow & Arrow" pattern.
This pattern can be either bullish or bearish, but for today, I will be focusing on the bullish reversal patterns.
On the chart, I have highlighted three previous examples for illustration purposes (in red, orange, and purple).
The pattern consists of three cycles:
1️⃣ First, there is a bearish impulse that breaks below a major low.
2️⃣ Second, a correction forms followed by another bearish impulse.
3️⃣ Third, the bulls take over, resulting in a complete shift in momentum.
📉 We can clearly see this pattern playing out nicely on the XRP weekly chart.
If we apply the same logic and pattern to the current price action, we would expect the next bullish impulse movement (3️⃣) to start soon, which should be confirmed on lower timeframes.
🗒 What do you think?
Always remember to follow your trading plan regarding entry, risk management, and trade management.
Good luck!
And always remember: All strategies are good if managed properly!
~Rich

Ethereum Classic to rally toward $21 soonThe H4 market structure was bearish, with the blue line highlighting the bearish MSB. However, the previous move upward that shifted the trend bullish was used to plot a set of Fibonacci retracement levels.
They showed the 50% retracement level at $17.06- a level that was tested a few hours earlier. It offered a good R:R opportunity to long, with invalidation below the 61.8% level.
Traders can re-evaluate the market in case prices drop below $16.43
Entry: $17.31
Stop-loss: $16.28
Take-Profit: $21
R:R: 3.58

BASIC INDICATOR GUIDE & MARKET PHASESBasic Indicator Guide for Trading.
Like & share it with others!!
✅Moving Averages: Moving averages calculate the average price over a specific period to smooth out price fluctuations and identify trends.
✅Parabolic SAR: The Parabolic SAR places dots above or below the price to indicate potential trend reversals, helping traders identify when to enter or exit positions.
✅RSI Indicator: The Relative Strength Index (RSI) measures the speed and change of price movements. It ranges from 0 to 100, with values above 70 indicating overbought conditions and values below 30 indicating oversold conditions.
✅MACD Indicator: The Moving Average Convergence Divergence (MACD) consists of two lines and a histogram. It helps identify trend changes and momentum shifts by analyzing the relationship between two moving averages.
✅ATR: The Average True Range (ATR) measures market volatility by calculating the average range between high and low prices. It helps determine stop-loss levels and position sizing based on current volatility.
✅Bollinger Bands: Bollinger Bands consist of a middle band (usually a moving average) and two outer bands representing price standard deviation. They indicate volatility, with wider bands suggesting higher volatility and narrower bands indicating lower volatility. They also help identify potential price reversals.
Which is your favourite indicator? Comment below👇🏻

EUR/USD VIEW IF POSSIBLEPlease if you found this helpful, kindly give me a like, follow and let us discuss it in the comment section.
First lets us wait for the correction to complete in order to get clear direction. The market price needs to test around 1.07839, and 0.07650 to form a clear bullish trend. We have ABCD already, but let us wait for wave E completion. After E wave we should prepare for the next bullish moves.
Goodluck

The Master Pattern - 3 Phases of the Market | Smart Money THE 3 PHASES OF THE MARKET
The market goes through 3 phases, these phases can be seen on all assets and on all time frames. They happen on repeat.
These phases can be identified and market on your chart, to understand the true intentions of the market and also predict what will happen next.
1) CONTRACTION PHASE
When price forms a LH and HL this is the start of the contraction phase, you draw a box around it. This is when the buyers and sellers equalize and there is low institutional volume. This is a leading indication, letting you know the expansion phase is going to come next.
2) EXPANSION PHASE
As soon as price expands out side of the contraction box this confirms the expansion phase has started. Price likes to whipsaw around the value line multiple times liquidation both sides of the market, this is how the market makers fill their massive orders. This symbolized volume coming back into the market. This is the phase where most retailers lose their money.
3) TREND PHASE
The trend phase is the 3rd phase in the market and this is the profit taking phase. This is the phase where the market makers take profits off their previously accumulated positions. This is the best phase to trade and the safest phase to trade.
When you understand these 3 phases, it can give you a deeper understanding to the Rhythm of the market and help you understand what will happen next.
By knowing what phase you are in, you are able to trade it according to its characteristic's.
The master pattern concepts is the the real smart money concepts.
Hope this helps.

MID TERM - LONG UPTRENDGold is expected to retest the resistance level at $1960 and then retrace back to the $1885 level. Let's break down this idea logically:
Influence of liquidity pools on the potential retesting of the $1960 level and subsequent retracement to $1885 in gold.
Liquidity Pools: A liquidity pool refers to a pool of funds provided by market participants to facilitate trading in decentralized exchanges or other financial platforms. These pools contribute to market liquidity, allowing for efficient trading and price discovery.
Resistance at $1960: If there is a significant liquidity pool near the $1960 resistance level, it can impact market dynamics. A well-capitalized liquidity pool can attract sellers as the price approaches the resistance, potentially leading to increased selling pressure and a retest of the resistance.
Retracement to $1885: Liquidity pools can also influence price retracements by providing liquidity and support levels in the market.
Retracement to $1885: If there is a substantial liquidity pool or a cluster of buy orders near the $1885 level, it can act as a support zone. Traders may anticipate buyers stepping in to take advantage of the liquidity provided by the pool, potentially leading to a retracement in price toward the $1885 level.
Considering the presence of liquidity pools near resistance and support levels, traders who predict a retest of the $1960 resistance level and a subsequent retracement to $1885 may base their thesis on the potential impact of liquidity pools on market behavior.
Please note that market conditions can change rapidly, and various factors can influence gold prices. It's essential to conduct thorough research, monitor market trends, and use appropriate risk management techniques when making trading decisions.

EURAUD I Short opportunity explained 150 + pipsWelcome back! Let me know your thoughts in the comments!
** EURAUD Analysis - Listen to video!
We recommend that you keep this pair on your watchlist and enter when the entry criteria of your strategy is met.
Please support this idea with a LIKE and COMMENT if you find it useful and Click "Follow" on our profile if you'd like these trade ideas delivered straight to your email in the future.
Thanks for your continued support!

EURGBP SHORT - BEARS STILL IN CONTROL!Waiting for a retest of 0.85680 to short EURGBP back to key 4H level at 0.85000
If you agree drop a like and if you have any questions leave a comment :)


is Fil Ready to go Down ?We are following the Price Action Purely, With a Proper Risk Reward and we will Suggest you to do the same with Risk management.
Reverse Flag & Pole

Engulfing candles = More Momentum ahead ⏳What we can observe here are Daily candles and Weekly Level's. To be more specific : A Daily timeframe Retest of a Weekly timeframe S/R level after a Daily engulfing candle. The weekly candle closing in 3 Hours at or below 1775 Weekly Support level looks great for bears. Bear pressure seems quite overwhelming and is coinciding with the opening of a new weekly candle. After 50 trading days of ranging since April 22nd, it appears price may be attempting to decease with some fundamental factors coming into play. The Technical's are screaming at us now to jump onto the train. This is a good risk/reward idea considering bearish market structure. If I was a buyer, I'd wait to see the size of the new weekly candle bottom wick before making an investment decision. Considering momentum, we must appreciate the fact that the next weekly candle will likely attempt to fill at least part of the current weekly candles bottom wick ( which is -3.12% ).

EUR/USD - London Session June 16 '23EUR/USD trade idea. Main concept behind this is return to fair value after manipulation of the Asian high on London open. Trade is aggressive because price didn't close below the range when breaking out on m15, not confirming a strong market structure shift. On HTF we reacted on a nice FVG and we are looking for a bearish move below to seek balance around the 50% level of the swing we are currently on. Good luck traders

SPX retest pre covid highs? Me thinks soTo me, it looks like SPX is going to retest the pre-covid highs. Major stocks will fall through their current floors....cheap buying opportunities are on the horizon

Potential Sell on AUDUSDHere are a few factors to consider as we take on this outlook on the pair:
Weekly
-the weekly structure is STILL bearish, regardless of the current bullish push
-we have returned to the ranging market parameters we had seen in the previous 12 weeks prior to the week of 20th May
-0.68000 and 0.66000 played a pivotal role in price action during those 12 weeks
-we are, currently, at 0.68000 institutional zone
-we are still in a potent selloff to fulfill the -27% extension on the weekly
H4:
-we have (14th June) tapped into the May high and slipped back below it to indicate that we simply grabbed liquidity
-price came up once more and got rejection off the high's level (0.68180) and is currently being maintained under it
-the recent bullish assault on the pair may end up being just that- a hunt for liquidity
-price is currently at the critical price zone of 0.68000
This being the case, the sell trade will be entirely dependent on:
-a break of structure to the downside on the midrange (H1)
-a retracement (preferably back to 0.68000 to fill institutional orders)
-a key level rejection (daily or H4)
-former H4 wick/order zone being tapped
-a fib level to act as minor confluence
Target: 0.67000 overall, generally the -27% extension of the new swing
Please note that, considering recent momentum, we might as well break structure to the upside and abandon the bear market.
If this happens, I shall adjust my view and seek highs above 0.68400.
This is why a break in structure below 0.67500 is critical before engaging sells.
NOTE: this is not financial advice and is just my opinion on the pair. Kindly make financial decisions based on your own assessment and analysis of the market.


EURUSD | Supply and Demand | 13 JUN 23M15 structure is aligned with H4 and M15 int structure. Currently just had a M15 and H4 bos so we can expect a pullback on those timeframes. Longs still valid since we are bullish but stay caution because internal structure could change.

EUR/USD -Swing Trade 'Short Opportunity'- Swing Short Trade opportunity for $EUR/USD
Short trade within Ascending Triangle,
which is a Neutral Pattern that can be broken either
to Bulls or Bears.
Demand yells for lower $EUR/USD.
Even on Volume Profile ; 4Hr* (TF)
Stay Sharp !
Until the next one ..
TRADE SAFE
*** NOTE that this is not Financial Advice
Please do your own research and consult your own Financial
Advisor before partaking on any trading activity based
solely on this Idea
