Keep an eye on $BNB/USDTHighly expected BNB price will bounce from here at current price $220
Did you find this crypto market analysis helpful? Stay updated about the latest crypto market update.
Please continue to follow my analysis and feel free to ask any queries, you may have. I am here to assist you.
TradingView: @FarmanBangashh
Marketstructure

CHFJPY LONG - BULLS STILL ALIVE!Waiting for a retest of 153.969 to long CHFJPY back to 4H swing highs at 155.346
If you agree drop a like and if you have any questions leave a comment :)

NZDJPY LONG - BIG SWING AT PLAY!Waiting for a retest of 85.050 to long NZDJPY back to Daily swing highs at 87.236
If you agree drop a like and if you have any questions leave a comment :)

ETHERIUM LONG TERM market update I hope u know that this is a personal opinion and everything can happen in between this trends or s/r levels and market will never care about our feelings but we can have different opinions at the same time for ourselves and with risk management and stop losses for short term trades we can decide what to do at different points of live market
I hope u have the same opinion

Opening week GBP/USD tradeOn the daily chart we took buyer liquid above the right shoulder resistance level , so I expect a short term pull back to smaller right shoulder below the right shoulder at 650 at least … wait for later session and a bull trap above the trend line for the short opp back down .

TRON retains bullish structure after liquidity grabThe move below the higher low at $0.0752 on 1 June was a liquidity hunt since this break of structure (formation of lower low) was not followed by a lower high and another lower low. Instead, prices pushed past the previous local highs at $0.08
Fibonacci retracement levels showed the 78.6% retracement at $0.0765 was retested as support and TRX bounced higher. This suggested TRX could reach higher to the 23.6% extension level at $0.0885
Entry: $0.0773
Stop-loss: $0.0738 (below the recent low)
Take-profit: $0.0885
R:R- 3.1
Given the sentiment in the crypto market, profits can also be taken near the $0.0858 mark

Fake Breakout / Fakeout BTC 🔄This view of BTC comes from a background of Price action trading. Trading Fakeout's are quite common in the Forex market and have proven to be a cornerstone of my Trading Strategy.
Fakeout's occur on all timeframes and take the market for an unpleasant ride. Traders Buy the breakout or in this case Short the breakout hoping to jump on the train and continue to lower prices. The liquidity that is generated is consequently used by large players to
1) Scale out of their short positions and
2) To gradually accumulate opposing orders ( In this case Buy orders )
Fakeout's are not hard to anticipate and are somewhat similar to trading support and resistance levels.
The only difference being the sequence in which the market sets itself up prior to the support and resistance bounce.
In this case we can observe that the price on the Daily timeframe has been bouncing between 26,400$ and 27,400$ since May 12.
Price recently closed quite the bearish candle on June 5th ; closing outside of our previously mentioned range.
A good Risk/Reward idea suggests that we may bounce from the bottom of the range.

EURUSD short signal- My draw on price is the PWL
- I believe EU has priced in HOTW yesterday
- For context GU has taken yesterday's high so EU should protect it
- My entry is at the London highs


Retest Bitcoin! Or a Dip and go? 🎐Headed to 24,300$ Daily Support and also Weekly S/R Zone. The question is if we have a sweep of late short orders and an abrupt pullback to our previous Daily S/R Zone (26,301$) before further downside. Now that we have gained liquidity after sweeping above 27,400 Daily Resistance level, probabilities suggest we will continue to the downside. We did not have this bullish sweep when I posted a short analysis on May 25th when pricee dipped to 26K. With the new Monthly candle came re-invigorated bears. I think it's safe to say that Bull positions from earlier in the Year took profit around 28K to 30K after the asset was up 80% on the year. For an Institution was that not enough? I doubt it and am thinking that they have taken some profit. As the Second Quarter comes to a close, we can see that price has pulled back 17% from the highs and is still 55% up on the year. We have some more downside to give on BTC. This Daily engulfing candle will create some fear for those holding from earlier in the year. 24,307 is not far off and we are offically entering another Bear market at least in the Medium term. Lower Lows and Lower Highs as Bitcoin backs off 30,000$.

BTC Triple Bottom Loading We can see the nice triple bottom forming ON BTC. 26200 level is def a poi IMO. Thoughts or ideas feel free to share

24500 Btc Crossroads IMO 24.5 area looks to be the make it or break it spot. 24.5 is untested order block. Also on diagonal support, id wanna see how price reacts. 22k or 32 k still in my eyes. Patience = Profits

GBPUSD short idea - I believe that the PWH will stay protected
- My narrative is that we will take Mondays (todays) high and price in HOTW either tomorrow or Wednesday
- PWL seems like a reasonable draw

$EURUSD PULLBACKFX:EURUSD is in a pullback after a 4H TC, entering a 4H demand zone with no reaction yet, waiting for big banks to lunch their trades maybe after the ISM .
Keep in mind that the daily is bearish .

EURGBP SHORT - LOOKING FOR RETEST!Waiting for a retest of 0.86764 to short EURGBP back to 4H swing lows at 0.856763
If you agree drop a like and if you have any questions leave a comment :)

GBPUSD buy setup - DXY is yet to take a PWH which lines up nicely with GU to take PWL as the present draw
- following the weekly cycle, we can see potential buy setups forming after we sweep this low
- next target should be 4h recent high easily to form 4h range

USDCAD - Bears Took Over, Now Wait For Bulls! Again!Hello TradingView Family / Fellow Traders. This is Richard, also known as theSignalyst.
As per my last analysis (attached on the chart) we have been stuck inside a big range in the shape of a symmetrical triangle, so we have been trading it.
Now USDCAD is sitting around the lower bound of the symmetrical triangle again so we will be looking for buy setups on lower timeframes.
Moreover, the green zone is a strong support.
🏹 So the highlighted purple circle is a strong area to look for buy setups as it is the intersection of the green support and lower red trendline. (acting as non-horizontal support)
As per my trading style:
As USDCAD is sitting around the purple circle zone, I will be looking for bullish reversal setups (like a double bottom pattern, trendline break , and so on...)
📚 Always follow your trading plan regarding entry, risk management, and trade management.
Good luck!
All Strategies Are Good; If Managed Properly!
~Rich

EURAUD I Approaching daily structure and strong demandWelcome back! Let me know your thoughts in the comments!
** GBPUSD Analysis - Listen to video!
We recommend that you keep this pair on your watchlist and enter when the entry criteria of your strategy is met.
Please support this idea with a LIKE and COMMENT if you find it useful and Click "Follow" on our profile if you'd like these trade ideas delivered straight to your email in the future.
Thanks for your continued support!

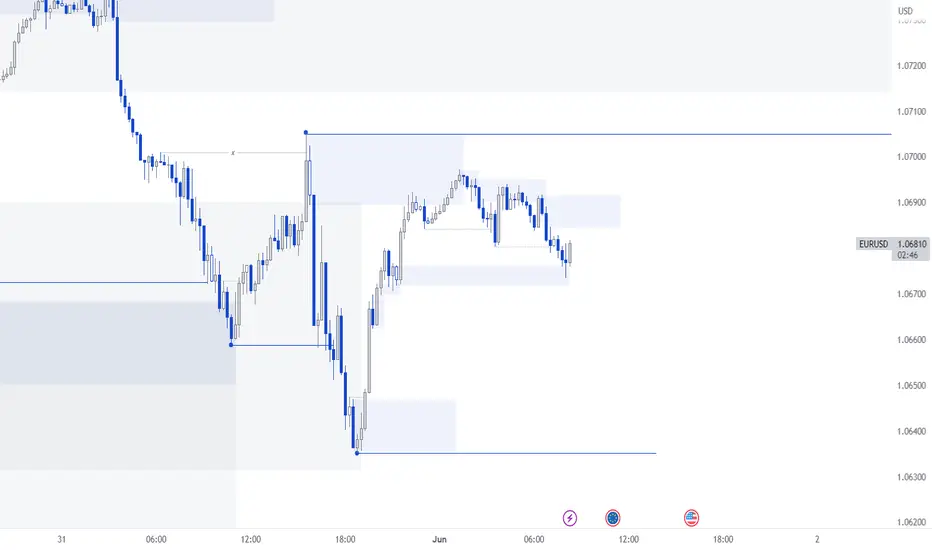
EURUSD | Supply and Demand | 1 JUN 23EU had a H4 Swing CHoCH, Daily Swing Pullback may have finished, Longs can become higher probability during this weeks

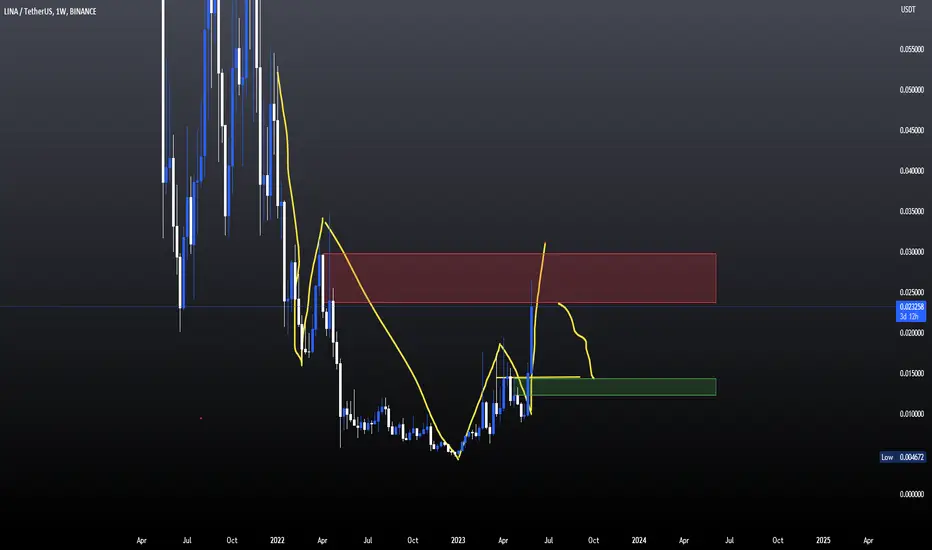
Keep an eye on $LINA/USDTKeep an eye on $LINA/USDT
Making LL HH currently on LH region
Kindly wait for breakout of the structure and target region marked
Did you find this crypto market analysis helpful? Stay updated about the latest crypto market update.
Please continue to follow my analysis and feel free to ask any queries, you may have. I am here to assist you.
TradingView: @FarmanBangashh
EURUSD | Supply and Demand | 1 JUN 23M15 Time Frame | LONDON OPEN | Market Structure | Supply and Demand POI | Liquidity
CHFJPY I It will rise from supportWelcome back! Let me know your thoughts in the comments!
** CHFJPY Analysis - Listen to video!
We recommend that you keep this pair on your watchlist and enter when the entry criteria of your strategy is met.
Please support this idea with a LIKE and COMMENT if you find it useful and Click "Follow" on our profile if you'd like these trade ideas delivered straight to your email in the future.
Thanks for your continued support!

XRP to push toward $0.5 soonThe market structure on the H4 chart was about to flip bullish. The FVG at $0.46 could offer an entry for long positions after a bullish MSB.
Weak BTC meant $0.48 and $0.49 resistances could pose a substantial threat, especially over the weekend when extra volatility could arise. The Fibonacci levels are based on the move from $0.34 to $0.585 in late March.
Entry: $0.458
Target: $0.494
Stop-loss: $0.443 (below recent swing low)
