AUD/JPY BUY SETUP Based on the trend, we seeing a transition to upward trend , basically key point to note is price action trend to be in slow waves when it respect the 61.8% fib level
so we shall see another leg up to our target
Follow me for more break down
Marketstructure

GBP/CHF BUY ASAP 185 PIPSSimply market structure has changed , price respecting fib level.
Nice risk to reward
follow me for more updates

Keep an eye on $ID/USDTAccumulate it ranges 🤝 binance
Target mentioned
Noted: Not a financial advisor.
It's always recommended to carefully consider all the factors and conduct thorough research before making any investment decisions. I suggest seeking advice from a licensed financial advisor.

#PERSISTENT... looking good 17.05.23#PERSISTENT.. ✅▶️
Intraday as well as swing trade
All levels given in charts ...
IF good potential seen then we work in options also
if activate then possible a huge movement Keep eye on this ...
We take trade only when it activates...
Possible to give good target
TRADING FACTS

Bitcoin Bulls Must Neutralize This Pattern DevelopingBitcoin Bulls need to push and hold above $28,200 to neutralize this pattern developing.
Otherwise, bearish market structure develops with LHs and LL with a LL retest if Friday's low is taken out.
A break out above upside trend line to resume upside momentum.

XAUUSD Bullish TargetOn price action and market structure point of view, we saw that there's a possibility of a bullish side movement for XAUUSD.
Disclaimer: Not financial advice!

When to Change Your Bias 🎯Welcome Back Traders!
In this education idea, I explain how to improve your trading bias, by knowing when to change it based on the movement of price action.
Please support this education with a LIKE and COMMENT if you find it useful and Click "Follow" on our profile if you'd like our trade ideas
and education content delivered straight to your email in the future.
Thanks for your support and help in building the TradingView community.
Kind regards,
BK Trading Academy

Bitcoin's Update, Fluctuations and Trend Reversal PotentialIn the past 24 hours, the market has demonstrated a combination of upward and downward fluctuations. Notably, Bitcoin has been experiencing a short-term downward trend, briefly dropping below the $26,000 threshold and finding support near $25,800. This price movement has elicited a notable positive response within the market.
The support range of Bitcoin's previous range channel, which had been breached and has now transitioned into a resistance level, has temporarily impeded the cryptocurrency's short-term price growth. Nevertheless, there are indications of potential trend reversal in lower timeframes, suggesting the possibility of continued upward corrective movement towards the resistance range at $27,700.
It is noteworthy that the Relative Strength Index (RSI) is currently at a level of 41, indicating a neutral stance. Additionally, the Moving Average Convergence Divergence (MACD) is at a significant level of -345.
Taking these indicators into consideration, it is important to approach the market with caution. The downward trend in Bitcoin, coupled with the negative MACD reading, suggests that selling pressure may persist. However, the potential for trend reversal indicated by the RSI and the possibility of retesting the support level at $26,500 imply that there could be opportunities for upward movement.
Overall, the market has experienced mixed dynamics, with Bitcoin facing a temporary setback in its short-term growth. While caution is advised due to the negative MACD reading, the RSI and the potential support retest present prospects for future price developments.

EURUSD short setup- MMSM confirmed as we have taken buyside and pulled into a premium in weekly range
- 1.05161 is the target

EURCAD 1.47143 -0.06 % SHORT IDEA 🐻📉💡HELLO EVERYONE
HOPE EVERYONE IS DOING GOOD.
* Looking at EUR/CAD INTO THE LONDON SESSION
1. ASIAS BSL TAKEN.
2. LOOKING FOR A PUSH INTO THE -OB / FVG.
3. Looking at momentum heading into the PD arrays.
4. Looking at that unfilled FVG as a possible entry with the bears.
5. TARGET would be the the SSL & THE DAILY +OB.
lets see how it goes.
IF THIS IDEA ASSISTS IN ANY OR IF YOU LIKE THIS ONE
SMASH THAT LIKE BUTTON & LEAVE A COMMENT.
ALWAYS APPRECIATED
____________________________________________________________________________________________________________________
* Kindly follow your entry rules on entries & stops. |* Some of The idea's may be predictive yet are not financial advice or signals. | *Trading plans can change at anytime reactive to the market. | * Many stars must align with the plan before executing the trade, kindly follow your rules & RISK MANAGEMENT.
_____________________________________________________________________________________________________________________
| * ENTRY & SL -KINDLY FOLLOW YOUR RULES | * RISK-MANAGEMENT | *PERIOD - I TAKE MY TRADES ON A INTRA DAY SESSIONS BASIS THIS IS NOT FINACIAL ADVICE TO EXCECUTE ❤
LOVELY TRADING WEEK TO YOU!

32 or 22K IMO ii still see a lot of bullish pressure possibly wanting to push price up to the 30-32k level. I def still see on more drop or test of support before the next bull run. I could see a Liquidity pick possibly to the 22 level. Exploring all possibilities. on multiple time frames identifying my trade zones and levels. I really dont think Bitcoin will be truly bullish until it can find support above the 32k level. Price is all bound up currently and is awaiting a break out. Will we see a test of the order block and bounce or fall?
Please share your thoughts and feed back

Are Crypto Bears in Denial? Eth 🌄Is this the Bull Run we have all been anticipating? Or Does Price need more time to accumulate above 2018 Highs. Ethereum has been trading in between 1942 Daily Level and 1785 Weekly Level for nearly a Month now. Price has spent 70% of the time inside this range. It spiked to the upside and stayed above the range for a week as some buyers Took Profit and shorts came in to flush out late longs. Price printed an engulfing candle on the Weekly Timeframe as price retreated back into our 1942 to 1785 range. We'll see if this bullish movment can sustain itself.

CADJPY - Video Top-Down Analysis!Hello TradingView Family / Fellow Traders. This is Richard, also known as theSignalyst.
Here is a detailed update top-down analysis for CADJPY.
Which scenario do you think is more likely to happen? and Why?
Always follow your trading plan regarding entry, risk management, and trade management.
Good Luck!.
All Strategies Are Good; If Managed Properly!
~Rich

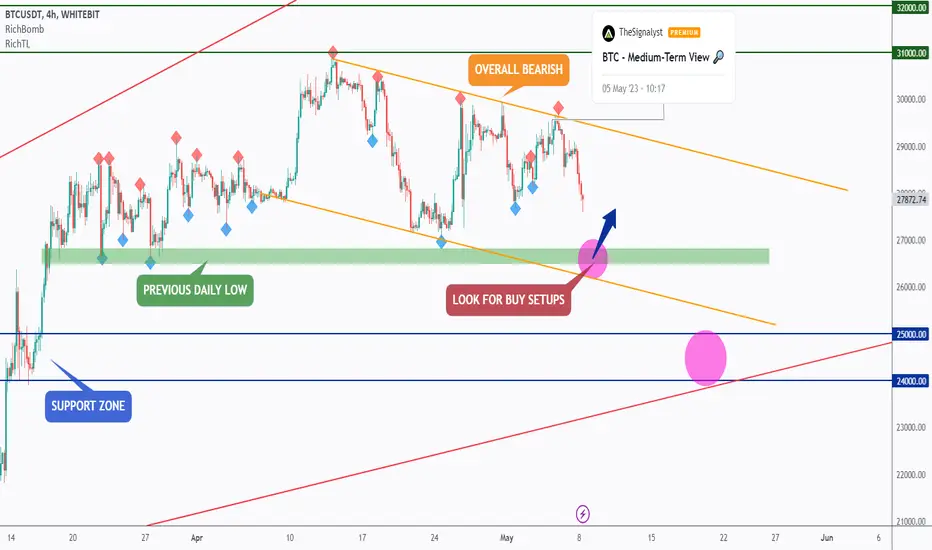
BTC - Correction Started ❗️Hello TradingView Family / Fellow Traders. This is Richard, also known as theSignalyst.
As per my last analysis (attached on the chart), we know that the correction already started as BTC broke below the last H1 low.
Now what?
🏹 BTC is still overall bearish, and we are expecting a movement till the lower bound of the orange channel which is also lining up with the previous daily low in green.
📈 As per my trading style:
As BTC approaches the purple circle zone, I will be looking for bullish reversal setups (like a double bottom pattern, trendline break , and so on...)
UNLESS the green daily low is broken downward. In this case a deeper correction movement till the 25,000 support would be expected.
Which scenario do you think is more likely to happen first? and why?
📚 Always follow your trading plan regarding entry, risk management, and trade management.
Good luck!
All Strategies Are Good; If Managed Properly!
~Rich
ES1!Taking a different approach and using displacement events and market imbalances to gather a bias
Wkly
s3.tradingview.com
Daily
s3.tradingview.com

BANK NIFTY ANALYSIS - 08/05/2023BUY ABOVE - 42830
SL - 42670
TARGETS - 43000,43100,43270
SELL BELOW - 42580
SL - 42670
TARGETS - 42440,42290,42180
Trade Safe & Happy Trading Guys
This is only for educational purpose so TAKE YOUR OWN RISK REWARD

EURUSD STILL POINTING LONGEURUSD price is now at the highest KEY level for this 4H Range (1.10920 area). The Direction is still LONG as for 4H, Daily and Weekly. as for Shorts shall be on ranges 15min and 5min short term sells.
Hence we will wait for the Pullback of 4H to get Short and a Pullback on 15min shall be the entry point for the the Sell above 1.10920 area.
For Longs still it will be risky to Buy at 15min Ranges but still a good range to trade if you can manage to take the 5min restructure of price to the upside.
so for Buy - 15min range is 1.10917 - 1.10220 to buy look for 5min restructure to the upside around price are 1.10300.
Sell - Price must first break the highest structure 4h and 15min to enable to get a clean sell, Look for the 15min restructure to the downside.

US30 Sell ASAP!! 430pipsPrice is facing huge resistance and liquidity short. so we see a nice break of structure and now price is respecting the 38.2% fib level so nice short
FOLLOW ME FOR MORE BREAKDOWN

Potential Upside Breakout or Downside Correction?let's dive into the world of Bitcoin and try to make some sense of the current market situation. As of the latest news, Bitcoin seems to be showing some positive signs, with the price experiencing growth of 1000 dollars in the last 24 hours from the 27900 range. This growth is largely attributed to the positive reaction shown by Bitcoin to two important supports. Currently, the price is approaching a minor resistance in the 28900 - 29000 range. However, given the economic news, the meeting of the Federal Reserve's Free Market Committee, and the new interest rate being announced, there is a high possibility of extreme fluctuations in all financial markets, including digital currency. As such, it is recommended to avoid futures trades with high leverage and manage short-term trades. For the medium term, there is potential for a correction in Bitcoin's price, but there is also a possibility of a positive swing before the correction.
Now, let's look at some key prices on this chart. Based on the 4-hour timeframe, we can see that the local solid supports are at the 0 Fibonacci level of 27666 and the lower Bollinger band of 27637. On the other hand, the minor resistance can be seen at the 0.5 Fibonacci level of 28817 and the upper Bollinger band of 29603. In between these levels, we have the middle Bollinger band at 28620.
As for the bullish scenario, if Bitcoin manages to break through the minor resistance at the 0.5 Fibonacci level of 28817 and the upper Bollinger band of 29603, it could indicate a potential upward trend. This could be further confirmed if the RSI crosses above the 50 level, the MACD starts to rise, and the volume oscillator turns positive. If these indicators all align, we could see Bitcoin testing the 1 Fibonacci level of 29969.
On the other hand, in a bearish scenario, if Bitcoin fails to break through the minor resistance and instead breaks below the local solid supports at the 0 Fibonacci level of 27666 and the lower Bollinger band of 27637, it could indicate a potential downward trend. This could be further confirmed if the RSI crosses below the 50 level, the MACD continues to decline, and the volume oscillator remains negative. If these indicators all align, we could see Bitcoin testing the 24h low of 27910.
In conclusion, the current market situation for Bitcoin seems to be volatile and uncertain. It is important to monitor the various indicators and key prices to determine potential bullish and bearish scenarios. As always, it is recommended to exercise caution and manage risk appropriately.

XAUUSD LONG 30minwas able identify the liquidity , then traced the structures and point out possible liquidity to avoid position, through the structure of the market I was bale to pin point fake OB to avoid being induced hope this is able to clarify the markets direction. this is not a financial advice all action taken in the market are at our own risk

Spy500: Elliot wave. Zoom out. Bigger correction incoming Studied Elliot wave theory only for about 2 years. Any input appreciated.
Is anyone seeing this?
IMO, I believe we could hit wave 5 of 3 hit the 4.236 fib and then big correction incoming.
If fed continues to raise hike, war escalates, hyperinflation, etc - I believe we may have already complete this wave and we could be just on the BRINK of a much bigger bear market. In which case, further pain must happen and spy could go as low as 215.

Wyckoff Cycle - Practical Example 📚Dear TradingView community and fellow traders,
I am Richard, also known as theSignalyst.
I find the BTC weekly chart to be intriguing as it appears to be following the famous Wyckoff Cycle.
I would like to apply Richard Wyckoff's four market stages/phases to this chart for analysis as a practical example.
1️⃣ Distribution
BTC appears to have rejected the 68,000 level and is now in a distribution phase
2️⃣ MarkDown
After breaking below 56,500 back in November 2021, BTC entered the MarkDown phase and began making lower highs and lower lows.
📉 The bearish impulse movements were initially large and steep. However, starting in July 2022, the bears seem to have exhausted themselves, resulting in a flat and small impulse movement.
According to Charles Dow, this signals an early alert for a potential shift in momentum, which brings us to the Accumulation phase as per Richard Wyckoff.
3️⃣ Accumulation
BTC is currently trading within a big range between 15,500 and 25,000 in the shape of an inverse head and shoulders as it forms a minor lower low followed by a higher low.
4️⃣ MarkUp
BTC broke above the previous major high marked in gray, indicating that the bulls may finally be strong enough to take over for the first time since late 2021, thus entering the MarkUp phase.
🏹 BTC is now approaching a key resistance/supply zone. For the bulls to remain in control from a long-term perspective, we need a weekly candle close above 32,000. Alternatively, the bears may still form one last HL before BTC breaks above 32,000.
I hope you find this post useful, and I would appreciate your likes and support.
Which scenario do you think is more likely to happen first? and why?
📚 Always follow your trading plan regarding entry, risk management, and trade management.
Good luck!
All Strategies Are Good; If Managed Properly!
~Richard

EURUSD A SELL BEFORE THE BUYEURUSD - Direction is still for the Bullish Side. From timeframes Weekly, Daily and 4h.
analysis is there are multiple Short Opportunities that had been provided early in this daily session, my hunch is that market is building up liquidity to take later on London or the US Sessions.
so in order to take Longs in this key level (1.10450 - 1.09623) the market must first print a 5min break of structure to the upside in order to execute for the trade once confirmed. tight stoploss is needed because of what i said in the previous Idea I published it may go below the key level 1.09623-617 down below and it may happen it the do so.
so in order to grab the opportunities for longs 5min break of structure is needed.
minimum targets 20-30pips and hold or 10pips BE
for shorts as long as we are on this 15min range / 15min pullback heading downside, we must execute all shorts after a 5min break of structure to the downside and once confirmed. sl is tight because market is still bullish in the pullback 15min phase it may continue to go long as it can sustain its 5min breaks. minimum target 20 - 30 pips and 10pips BE
current price - 1.09970
