BTC - Still Bullish - For Now! ⏰Hello TradingView Family / Fellow Traders. This is Richard, also known as theSignalyst.
🗒 After rejection the 20,000 round number, BTC broke above the last major high in gray, and have been bullish since then.
We will remain bullish as long as BTC doesn't break a previous major low.
The current last major low is highlighted in gray around 26,700
📌 If we break below 26,700 expect a bearish correction to start till around 25,000 support.
🏹 Meanwhile, we are still bullish and the bulls would take full control again by breaking above the current minor high in gray around 28,500
In this case, a movement till the 30,000 weekly supply zone is expected.
Which scenario do you think is more likely to happen first? and why?
📚 Always follow your trading plan regarding entry, risk management, and trade management.
Good luck!
All Strategies Are Good; If Managed Properly!
~Rich
Marketstructure

GOLD : How to trade with Rsi IndicatorOANDA:XAUUSD
What Does RSI Mean?
The relative strength index (RSI) measures the price momentum of a stock or other security. The basic idea behind the RSI is to measure how quickly traders are bidding the price of the security up or down. The RSI plots this result on a scale of 0 to 100.
Readings below 30 generally indicate that the stock is oversold, while readings above 70 indicate that it is overbought. Traders will often place this RSI chart below the price chart for the security, so they can compare its recent momentum against its market price.
How do you trade effectively with RSI?
The common levels to pay attention to when trading with the RSI are 70 and 30. An RSI of over 70 is considered overbought. When it below 30 it is considered oversold. Trading based on RSI indicators is often the starting point when considering a trade, and many traders place alerts at the 70 and 30 marks.
KEY TAKEAWAYS
The relative strength index (RSI) is a popular momentum oscillator introduced in 1978.
The RSI provides technical traders with signals about bullish and bearish price momentum, and it is often plotted beneath the graph of an asset’s price.
An asset is usually considered overbought when the RSI is above 70 and oversold when it is below 30.
The RSI line crossing below the overbought line or above oversold line is often seen by traders as a signal to buy or sell.
The RSI works best in trading ranges rather than trending markets.

GOLD : What Should Be Ideal Risk Reward Ratio OANDA:XAUUSD
A good risk/reward ratio could be seen as greater than 1:3,
where you would risk 1/4 of the overall potential profit.
For trading to prove profitable in the long term, a trader should not typically risk their capital for a lower risk/reward ratio,
as this will mean that half or more of their investment could be lost.
The risk/reward ratio marks the prospective reward an investor can earn for every dollar they risk on an investment. Many investors use risk/reward ratios to compare the expected returns of an investment with the amount of risk they must undertake to earn these returns. A lower risk/return ratio is often preferable as it signals less risk for an equivalent potential gain.
Consider the following example: an investment with a risk-reward ratio of 1:7 suggests that an investor is willing to risk $1, for the prospect of earning $7. Alternatively, a risk/reward ratio of 1:3 signals that an investor should expect to invest $1, for the prospect of earning $3 on their investment.
Traders often use this approach to plan which trades to take, and the ratio is calculated by dividing the amount a trader stands to lose if the price of an asset moves in an unexpected direction (the risk) by the amount of profit the trader expects to have made when the position is closed (the reward).
KEY TAKEAWAYS
The risk/reward ratio is used by traders and investors to manage their capital and risk of loss.
The ratio helps assess the expected return and risk of a given trade.
In general, the greater the risk, the greater the expected return demanded.
An appropriate risk reward ratio tends to be anything greater than 1:3.


Bitcoin's Battle! Bulls vs. Bears! (TA - FA)Bitcoin is currently trading at $27,280, which is near the upper Bollinger band of the 4-hour timeframe. This indicates that Bitcoin is trading at a relatively high price compared to its recent price range, and it may face some resistance at this level. The RSI of 56 is in the neutral zone, indicating that Bitcoin is neither overbought nor oversold.
The Fibonacci retracement levels of the 4-hour timeframe are also important to consider. The 0.5 Fibonacci level at $25,827 may act as a support level if Bitcoin faces a price correction, while the 1 Fibonacci level at $23,900 may act as a stronger support level. On the other hand, the 0 Fibonacci level at $27,757 may act as a resistance level if Bitcoin continues to rise.
The volume oscillator of -18% suggests that the trading volume of Bitcoin has decreased recently, which may indicate a lack of interest from traders. However, the MACD of 792 is in positive territory, which suggests that the momentum of Bitcoin's price is currently bullish. The Stochastic oscillators of 75 also indicate that Bitcoin is currently in a bullish phase.
The 4-hour EMA 50 of $25,042 may act as a support level if Bitcoin faces a price correction. This is also near the 0.5 Fibonacci level, which strengthens the support level. The middle Bollinger band of the 4-hour timeframe at $26,563 may also act as a support level.
On the daily timeframe, the Fibonacci retracement levels are also important to consider. The 0.5 Fibonacci level at $22,399 may act as a strong support level if Bitcoin faces a significant price correction, while the 1 Fibonacci level at $25,250 may act as an even stronger support level. The daily timeframe also suggests that Bitcoin has been in a bullish trend since it broke above the 0 Fibonacci level at $19,549.
The recent news that Bitcoin's market dominance has hit a 9-month high as altcoins turn red is also worth considering. This indicates that Bitcoin is currently outperforming other cryptocurrencies in terms of market capitalization. However, this could also indicate a potential shift in the cryptocurrency market, as investors may be moving away from altcoins and towards Bitcoin.
Bullish scenario:
If Bitcoin continues to hold above the 4-hour timeframe 0.5 Fibonacci support level of $25,827 and the daily timeframe 0.5 Fibonacci support level of $22,399, it may continue its bullish trend. In this scenario, Bitcoin may break through the 4-hour timeframe 0 Fibonacci resistance level of $27,757 and the 4-hour timeframe upper Bollinger band of $28,418. The MACD of 792 and Stochastic oscillators of 75 both suggest that Bitcoin's momentum is currently bullish, and if these indicators remain positive, Bitcoin may continue to rise and potentially reach new highs.
In conclusion, Bitcoin is currently trading at a relatively high price compared to its recent price range, and it may face some resistance at the upper Bollinger band of the 4-hour timeframe. However, the momentum of Bitcoin's price is currently bullish, and there are several support levels that may prevent a significant price correction. The recent news of Bitcoin's market dominance may also have an impact on its future price movements.
Bearish scenario:
If Bitcoin falls below the 4-hour timeframe 0.5 Fibonacci support level of $25,827 or the daily timeframe 0.5 Fibonacci support level of $22,399, it may indicate a potential shift to a bearish trend. In this scenario, Bitcoin may face resistance at the 4-hour timeframe 0 Fibonacci resistance level of $27,757 and potentially even the 4-hour timeframe middle Bollinger band of $26,563. The volume oscillator of -18% and the recent news of Bitcoin's market dominance hitting a 9-month high as altcoins turn red suggest a lack of interest from traders and a potential shift away from altcoins to Bitcoin. If these indicators remain negative, Bitcoin may continue to fall and potentially test its solid support levels at the 4-hour timeframe 1 Fibonacci level of $23,900 and the daily timeframe 1 Fibonacci level of $25,250.

P2P | Deep Dive Into My SetupsHello family! Sending you all love and light today.
So I wanted to do an in-depth video about my style of attacking the markets now. I unlocked a new way to view my trades and I believe it just leveled up my confidence a TON!
So I will keep this description brief and go along with the day.
Thank you guys and gals, lets keep making it happen on trade at a time!

EURAUDAs a student of SMC, there might be a reversal probably by next week.
Divergence happening
market structure formed
major down trend
let's see how the price will react next week. If you have any idea or suggestions, drop a comment down below.

Potential Targets for Bullish and Bearish ScenariosBitcoin's current price is $26,600, trading above the 0.5 Fibonacci level of $25,142 and close to the upper Bollinger band of $26,573, which may act as solid resistance. However, the 4-hour EMA 50 at $23,719 is a crucial local support level, while the 0 Fibonacci level at $23,897 is a solid support level that has not been tested recently.
The RSI is high at 74, indicating that the asset may be overbought. However, the MACD is bullish at 886, while the stochastic oscillator is at 87, which suggests that there may still be potential for further upside movement.
Bitcoin has already surpassed the 1 Fibonacci level at $26,387, and if it can hold above this level, it may continue to climb toward the 1.618 Fibonacci level at $30,107. Nevertheless, it is crucial to monitor the support levels, as the asset may retrace from the current resistance levels.
The Bollinger bands are another critical indicator to watch. The lower band is at $23,606, which may offer support if the price begins to drop. The middle band at $25,087 can act as a pivot point for traders, and a breakout above or below this level may signal a change in the asset's price movement.
The volume oscillator is currently negative at -5.91%, indicating lower trading activity than previous periods. However, this may change if there is a significant price movement.
Recent news has highlighted that 74% of Bitcoin holders are currently in the money as the asset's price has exceeded $26,000. This suggests that there may be a higher level of confidence among Bitcoin investors, which may further drive the price higher. Moreover, there is speculation that Bitcoin is gearing up for a bullish weekend, which may lead to increased buying pressure and further price appreciation.
In summary, Bitcoin's technical indicators and recent news suggest that the asset may continue to climb higher, although traders should keep an eye on potential resistance levels and support levels for potential trading opportunities and risk management.

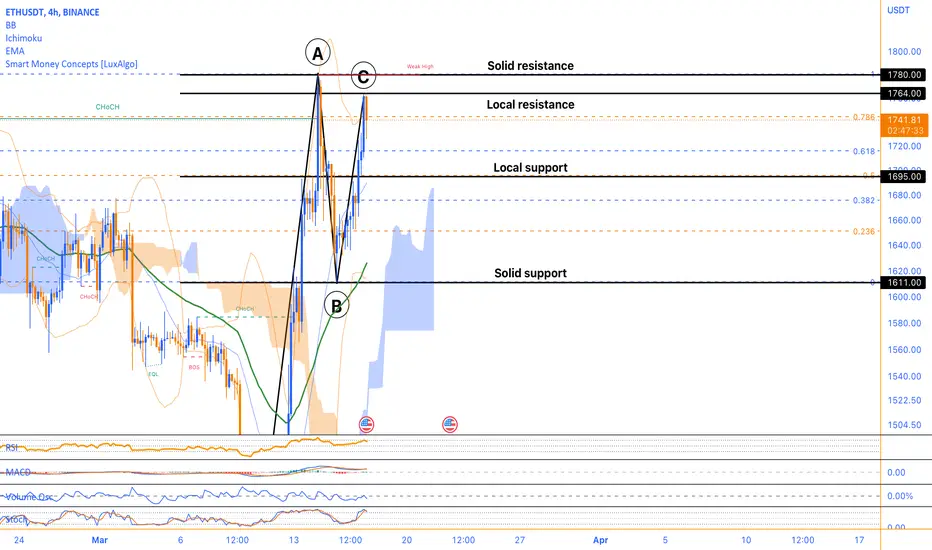
Riding the Bull, Key Support and Resistance LevelsLooking at the Ethereum chart, there are a few key prices that traders should keep an eye on. The current price is $1737, and technical indicators such as the RSI and stochastic oscillator suggest that the asset is currently in a bullish trend. The MACD is also positive, which indicates a strong momentum behind the asset's price movement.
However, there are also potential levels of support and resistance that traders should be aware of. The 0 Fibonacci level at 1611 could be a solid support level for the asset, as it is a significant Fibonacci retracement level. Additionally, the 0.5 Fibonacci level at 1695 could act as a local support level if the price were to experience any dips.
On the other hand, there are also potential levels of resistance to consider. The 1 Fibonacci level at 1780 could act as a solid resistance level for the asset, as it is a significant Fibonacci retracement level and close to the upper Bollinger band at 1764. Additionally, the upper Bollinger band could be a local resistance level to watch.
It is worth noting that the lower Bollinger band at 1615 could provide another level of support for the asset, while the middle Bollinger band at 1689 could provide an indication of the current price range. Furthermore, the volume oscillator is at -10%, which is not a strong indicator either way but is still worth considering.
In conclusion, traders should keep an eye on the potential levels of support and resistance, as well as the technical indicators, to make informed trading decisions. As always, risk management should be a priority to minimize potential losses.
Sell XAUUSD Looking for additional sell re-entry after yesterday's sell from my earlier post. Once price retraces up to balance out the FVG, will look for a confirmation move down to sell.

CADJPYThis will be my trade for CADJPY as the current market had made a new pattern on the chart. As a student of SMC, there is a break of structure, and it has a strong rejection on the OB. it may reverse from here. let's see how the price shall react.
if you do have any idea or suggestion, leave down your comment. let's discuss about it

A Deep Dive into Bitcoin's Technical Analysis and News ImpactBitcoin's current price is $24700, and it's being analyzed over a 4-hour timeframe. The Relative Strength Index (RSI) is 64, indicating that the cryptocurrency is in slightly overbought territory but still has some room to grow. The Volume oscillator is -8.52%, which indicates lower trading volume than average. The Moving Average Convergence Divergence (MACD) is currently at 1010, which indicates that the bullish momentum is strong, but it could turn into a bearish one if the trend reverses.
On the technical side, the 4-hour timeframe Fibonacci retracement levels suggest that Bitcoin's support levels are at 0.5 Fibonacci level of $22967 and 1 Fibonacci level of $19549, and resistance levels are at 0 Fibonacci level of $26386 and upper Bollinger band of $26813. The lower Bollinger band of $19820 is acting as strong support. The middle Bollinger band of $23317 indicates the average price level.
Bitcoin is facing a sharp correction in its price. The Paxful founder called the recent pump to $26000 as weak, indicating that it could be a bubble. On the other hand, a South Korean trader lost almost $1 million by shorting Bitcoin.
Based on the technical analysis, it seems that the current price of Bitcoin is likely to experience some resistance at the 0 Fibonacci level of $26386 and the upper Bollinger band of $26813. It may also find some support at the 0.5 Fibonacci level of $22967 and the lower Bollinger band of $19820. The sharp correction could have contributed to the lower trading volume indicated by the volume oscillator. The Paxful founder's statement may have added to the bearish sentiment, but the strong bullish momentum indicated by the MACD and Stochastic oscillators suggests that the current price drop may not last for long.
Regarding opening long or short positions, it depends on an individual's trading strategy and risk tolerance. However, here are some possible scenarios:
Long position: If the price bounces off the strong support levels and starts to move upwards, it could be a good spot to open a long position. Additionally, if the price breaks above the strong resistance levels with strong momentum, it could also be an opportunity to open a long position.
Short position: If the price breaks below the strong support levels with strong momentum, it could be a good spot to open a short position. Additionally, if the price reaches strong resistance levels and shows signs of rejection or reversal, it could also be an opportunity to open a short position.
It's essential to keep in mind that any trading decision should be made with proper risk management techniques in place, such as setting stop-loss orders and taking profits at predetermined levels. Additionally, traders should keep an eye on any relevant news or events that could impact the price of Bitcoin.

Riding the WavesLooking at the current price of Ethereum, it is trading at $1666, which is below the upper Bollinger band of $1808 but above the 4-hour EMA 50 of $1585. The RSI of 57.72 indicates that Ethereum is currently in a neutral zone and not overbought or oversold. However, the volume oscillator of -14.66% suggests that there is a lack of interest in the market, which could be a concern.
Despite the lack of interest in the market, Ethereum's MACD of 53.32 and Stochastic oscillator of 48.40 suggests that the price is in an uptrend. This could be good news for investors looking to open long positions. Additionally, the news article predicting that Ethereum's price could reach $1800 in the near future further supports the bullish sentiment.
Looking at the Fibonacci levels, Ethereum has strong support at the 0.5 Fibonacci level of $1574. If the price were to drop below this level and rebound, it could be a good spot for traders to open long positions with a stop-loss below the support level. On the other hand, if Ethereum breaks above the upper Bollinger band of $1808 with strong bullish momentum, it could be a good spot to open long positions with a stop-loss above the resistance level.
It is also important to consider the solid support level at the 1 Fibonacci level of $1368. This level could be a good spot for long-term investors to accumulate more Ethereum in case of a price decline. Additionally, traders should keep an eye on the psychological level of $2000, which could act as a solid resistance level. Breaking above this level could indicate a strong bullish trend and a good opportunity to open long positions.
In summary, Ethereum's current price, RSI, and volume oscillator suggest a neutral market sentiment, but the MACD and Stochastic oscillator indicates an uptrend. Traders should consider the support and resistance levels mentioned above when opening positions, and investors may want to accumulate more Ethereum at the solid support level of $1368. Keeping an eye on the psychological resistance level of $2000 is also important for traders.

GBP/USD Short - MARCH RECAPGreat A+ SETUP
Price created a L, looked for a RT towards EMA as added dynamic R - decent 4RR & P.A with bearish engulfing candle...Will monitor the trade !

$VRA - I want green zone for long term My plan of attack for Verasity ($VRA)
- retrace to 618 fib
- even if this is a first impulsive wave of a larger 5 wave structure, I'd expect retrace toward green
- green is also a macro break of bearish market structure (dashed line)
- it's a key monthly level as well (solid line)
This could still push higher, I would still look to long green
Invalidated on a weekly break and hold of red above.
Time will tell, I think this is a good area for long term positions I am interest in for this asset.
Cheers

GBP/USD Short - MARCH RECAPA+ setup with GU
Strong support zone between 1.21497-1.21448 ... monitor P.A
If 30m candle is an engulf will have to exit and manage loss accordingly...
Play wise, price created a low and RT, found EMA R and bearish pinbar by London open indicating downside momentum !
Larger than average RR - 6.8

P2P | DXY - What Could Happen Next?Hello family, thanks for tuning in again with us!
This is a concept video on DXY and some #technical and #fundamental talk. I only will place a trade based on my alerts, meaning I will mark my chart and later add alerts on certain zones. When price makes it to a particular zone I then use that data to form a trade on an opposing pair such as #Gold or #EU.
If you have any questions feel free to drop them in the comments, or even if you just want to say hello (: all are appreciated!
Thanks again family, I'm not the best trader, I'm the "rest" trader. I rest until I have to trade lol
Trade well, take care of yourselves and be great! #2023AintReady

CADJPY I Intraday short 40-60 pips 🚀Welcome back! Let me know your thoughts in the comments!
** CADJPY Analysis - Listen to video!
We recommend that you keep this pair on your watchlist and enter when the entry criteria of your strategy is met.
Please support this idea with a LIKE and COMMENT if you find it useful and Click "Follow" on our profile if you'd like these trade ideas delivered straight to your email in the future.
Thanks for your continued support!

Bitcoin's Price on a Roller Coaster!Bitcoin is currently trading at $24,700, and it's looking pretty overbought with an RSI of 77.5. The price has been making some impressive gains recently, surpassing the 0.5 Fibonacci retracement level of $21,105, and the 1 Fibonacci retracement level of $22,662. Now, it's sitting pretty close to the 1.618 Fibonacci retracement level at $24,585, which could act as solid resistance in the short term.
But wait, there's more! The upper Bollinger band on the 4-hour timeframe is at $25,700, which is also close to the current price. This means that Bitcoin could face some significant resistance at this level. On the other hand, the 4-hour EMA 50 is at $22,135, which could provide some support if there's a price correction.
Moreover, the volume oscillator is at -17.63%, indicating that the trading volume is lower than usual, and the stochastic oscillator is at 96, which suggests that Bitcoin is trading near its overbought zone. These two indicators combined could potentially signal a consolidation phase for the cryptocurrency.
However, traders and investors should keep an eye out for potential market-moving events, such as regulatory announcements, institutional buying, or changes in market sentiment, which could cause volatility in the price of Bitcoin.
In terms of support levels, we have local support at $21,105, which is the 0.5 Fibonacci retracement level. But if there's a significant price correction, the 0 Fibonacci retracement level at $19,549 could act as a more solid support level.
To sum it up, Bitcoin's price is currently at a high point, but there's potential for resistance at the 1.618 Fibonacci retracement level and the upper Bollinger band. The trading volume is lower than average, and Bitcoin is trading near its overbought zone, which could lead to a consolidation phase. However, traders and investors should stay alert for potential market-moving events, and keep an eye on the support levels at $21,105 and $19,549, in case of a price correction.

Common Reasons Why Traders lose Money Even in an UptrendHi guys, This is CryptoMojo, One of the most active trading view authors and fastest-growing communities.
Consider following me for the latest updates and Long /Short calls on almost every exchange.
I post short mid and long-term trade setups too.
Let’s get to the chart!
I have tried my best to bring the best possible outcome to this chart, Do not consider financial advice.
Common Reasons Why Traders Lose Money Even in an Uptrend
#Not Setting Stop-Loss:
#Not Conducting Technical Analysis:
#Going against the Trends:
#Following the Herd:
#Being Impatient:
#Not doing Homework or Research:
#Averaging on Losing Position:
Buy low sell high' is the motto. As simple as it sounds, why do most people lose money trading or investing?
There are four major mistakes that most beginners make:
1. Excessive Confidence
This stems from the idea that people think of themselves as special. They think they can 'crack the code' in the stock market that 99.9% of people fail to, and eventually make a living trading and investing. However, taking into consideration the fact that more people lose money in the market, this form of wishful thinking is the same mentality as going into a casino feeling lucky. You may actually get lucky and win big the first few times, but in the end, the house always wins.
2. Distorted Judgements
While simplicity is key, the approach most beginners make in trading and investing are too simplistic, to the extend where it's hard to even call it a trading logic or reason to invest. They spot a few reoccurring patterns within the market, and this is almost as if they discovered fire. It doesn't take long to realize that the "pattern" they spotted was never based on any solid reasoning, or worse, wasn't even a pattern at all in the first place.
3. Herding Behavior
The fundamentals of this is also deeply rooted in a gambling mindset. Beginners are attracted to the idea of a single trade or investment that will make them a millionaire. However, they fail to realize that there is no such thing. Trading and investing is nothing like winning the lottery. It's about making consistent profits that compound throughout time. While people should definitely look for assets that have high liquidity and some volatility , the get-rich-quick mentality drags irrational beginners into overextended/overbought stocks that eventually drop drastically.
4. Risk Aversion
Risk aversion is a psychological trait embedded within all of mankind's DNA. Winning is fun, but we can't tolerate losing. We tend to avoid risk, even when the potential reward is worth pursuing. As such, many beginners take extremely small amounts of profits, in fear that they might close their position at a loss, trading with a terrible risk reward ratio. In the long run, their willingness to not take any risks leads to losses.
Depending on the price action, they also go through seven phases of psychological stages:
- Anxiety
- Interest
- Confidence
- Greed
- Doubt
- Concern
- Regret
------------------------------------------------------------------
Lack of Discipline
An intraday trader must stick to a proper plan. A full-fledged intraday plan includes profit targets, factors to consider, methods to put a stop loss, and ways to select the right trading hours. The trading plan provides a comprehensive overview of how trading should be executed. Also, you can keep a record of trades executed during the day with the performance analysis of each stock at the end of the day. Such records help you identify the weak areas in your trading strategy and correct them. It is very important to be disciplined as a trader, the proper discipline will help you minimize the losses and maintain your capital.
Not Setting Proper Trading Limits
In intraday trading, the success lies in managing the risk. You should pre-define a stop loss and profit target when entering intraday trading. This strategy itself is an important part of trading discipline and this is where most people fail. For instance, if you incur a loss in the first hour itself, you should shut down the trading terminal for the rest of the day. You should also have an overall capital loss limit in place, it will safeguard you against trading losses.
Compensating for a Rapid Loss
This is one of the common mistakes in the trading community. When a trader incurs a loss, he/she either tries to average a position or overtrades excessively to recover the loss. This further leads to a greater loss and put them into more trouble. Losses are a part of intraday trading, instead of overtrading, it is wise to accept the loss, analyze the strategy and make improvements from the next day.
Heavy Dependency on Tips
Nowadays, there are ample of intraday tips flowing everywhere on the digital media. It is a common phenomenon for a trader to rely on these external tips, however, this needs to be avoided. The best way to learn intraday trading is by gradually learning how to read charts, understanding structures, and interpreting results on your own. Many traders refrain from taking these efforts and because of this, they end up on the losing side. The Beyond App by Nirmal Bang provides deeper insights into the market, the technical research offered by Nirmal Bang is spot on. You can use that research for reference, however, nothing can beat practical experience.
Not Keeping Track of Current Affairs
The external news, events, and tragedies do have an impact on the stock market. Hence, it is important for an intraday trader to keep a track of the Indian as well as global markets. Even the performance of global markets has an impact on the movement of Indian markets. Make your trade after the news or event has been announced, do not try to speculate the market based on the news.
There are even instances when traders do not have any sound trading strategy, they just make decisions based on gut feelings or emotions. One needs to remember that intraday trading in itself is a skill, it is not a gamble, it takes time to develop proficiency, you cannot expect rapid results. The above are some of the major reasons why intraday traders lose money, ensure that you are disciplined enough, stick to a proper strategy, analyze your strategy at regular intervals, and things will fall in place.
This chart is likely to help you make better trade decisions if it does consider upvoting it.
I would also love to know your charts and views in the comment section.
Thank you

XAUUSD TRADING IDEA Hello traders
Gold is in an upward trend, but the prices premium, so expect the price to drop to retest the discount areas

Gold(Xauusd) Massive Buy setupCheck the video to get understanding on my view on Gold this week
Follow and comment below for other breakdowns

Us30 Sell setup 132 PipsCheck the video to get understanding on my view on us30 this week
Follow and comment below for other breakdowns
