EUR/CAD: pull back with hopes by technical analysisEuro/Canadian Dollar may to forming a possible bullish setup that we can to benefit for this short movement in long position. At the moment, there're some signal like RSI that form a bullish divergence forming a lower high, but there're not any signal in price action to entry in against the movement bearish when lead to bullish movement. For the moment, I will hope the confirmation of bullish pattern there. By the contrary, will be that EUR/CAD lead to $1.4410 CAD depending the type of price action we see, it's important to study it the behaviour. As 1.4410 work like resistance to short.
Now, in H4 timeframe I'm looking a long position based the points that I have mark there.
So guys, I hope that this analysis support you!!!
Marketstructure

EURGBPHi I'm still learning about market structure and trend analysis, based on what I've observed on EURGBP chart, as a SMC student, there might be a short trade. based on RSI on the monthly chart there seems to be a divergence happening.
Share your thoughts on the comment below on what do you think of EURGBP chart will look like.

GBPCAD Short Opportunity - FEBRUARYY RECAP Explanation within chart screenshot:
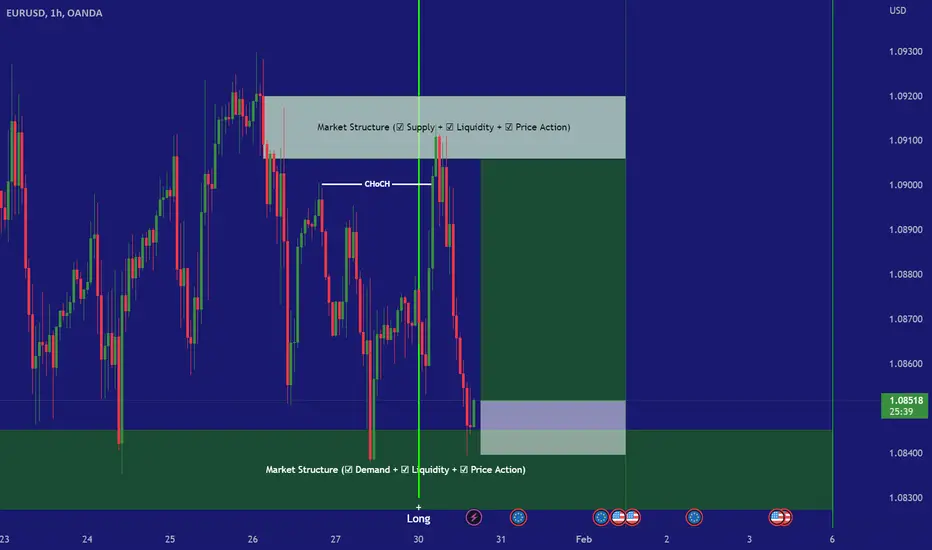
Looking for London downward momentum after DT formed - 2RR

BTC in decision moodit's just an idea, take the trade at your own risk,
As, BTC has formed curved graph, firstly it was bullish peanut, then converted to bull flag and now it has broken the curved trend line and ready to make decision, if stocks would green then we will see pump till 24200 otherwise ready to buy dip again

Strategy #1Support and resistance from last high and low on the daily timeframe.
Draw a trendline.
Use a fib from the first high/low to the last.
Use a reversed fib to correlate its extensions to the first fibs retracements.
2-3 confluences to take a trade.
100 pip stop loss.
30 pip stop loss for scalps.

USDJPY LONG4HR trendline was broken from NFP news that happened on last Friday with aggressive buying.
Waiting for price to mitigate a supply area and expecting to find positions on the 5/15 min timeframe with a bullish formation to buy from the 4HR zone break of structure expecting the continuation for long positions.

GBPJPY 4 HR - Using Liquidity to Analyze & Plan for the week.Hey guys,
This is my update for GJ for the next week or so.
There are so many things that can happen from here, because as we know, the market is never straightforward. These are just a few of my projections and i will slowly eliminate options and adjust my analysis as the week goes by and we start to see changes in both market conditions and price action.
I would need to see confirmations at my points of interests (not shown) for me to actually take a trade. But basically, we are still stuck in a consolidation, and we need to wait for price to remove liquidity at either the highs or lows so we can start seeing what price wants to do.
Right now, we are sitting in a bullish Fib to go higher, but I am not sure if it is a reversal fib or a retracement fib to go lower. I will definitely need more confirmation.
Basically - the way I see the market is that Liquidity, runs everything. Thats why there are so many manipulations and patterns etc. Price will remove buyers or sellers THEN continue in its desired direction. It needs to shake off all the people riding it before continuing and this is why I always say, 'If a setup looks too good to be true, it usually is.'
For example - Think of a marathon - If i was a marathon runner why would I run a marathon with a weighted backpack on and ankle weights? I would TRY to run; realize they were weighing me down, then I would throw them off and then continue running.
Thats basically how the market is with all the retail traders trying to ride it in all directions.
If it wants to start trending bullish for example - It may consolidate for a bit, accumulating buyers and sellers, retrace bullish or even just wick to remove liquidity and all sellers to shake them off before continuing bearish, because the buyers will be removed eventually as price starts trending down.
Thats how I see the market anyways and when I learnt to see the market like this and base all my projections/analysis around liquidity, I was able to become more aware of price manipulations and fake outs so i was able to avoid them.
Thinking like the banks and 'market makers' is the best way to become consistently profitable, because you will understand how and why price action moves and behaves in order to make money and you find yourself no longer getting stuck in liquidity traps and raids with the other retail traders.
You need to see where all the liquidity is on the chart and THEN do your analysis and projections.
Ask yourself -
- In order to make as much money as possible, what does the bank need to do?
- Which way is the most cost-effective way for the bank to move price? Because after all - The market is run like a business.
- When you have all of this THEN you can start to do your technical analysis.
- Does this look too good to be true?
- What are other retail traders looking at doing here?
- What does the market WANT them to do ?
When I began to ask myself these questions i really started seeing a huge difference in my trading and my consistency and i wish someone had told me this sooner in my journey!
:)

KWH Interday BuyKing W. Harbmayg's Journal Entry #1
Interday
Review: The direction came after a short which failed to break the previous low. It is also in alignment with my weekly buyside bias. Morning star is currently printing, which I ideally I should wait for the closing of the candle, and I decided to get in a bit early before the 5pm EST market close. I took it prematurely because of the information gleaned from the lower timeframes and that the 1H patterns are fairly reliable.
DAX SHORT (PAPER PRACTISE)Looked bearish after the middle green candle 10:15 couldn't push past the 9:00 open bear candle before the drawback (BSL) . The EMA's and the weakening of new highs gave me confluence that the internal SSL would be swept along with the 9:45 close SSL. Quick trade however should of waited for the imbalance to be filled ( double 1 m FVG) below the SSL and then close my positon to ensure that it is still a bullish market structure. Moved stop loss to 0 making it risk free after the 1m ticked past the first SSL. Entry and close marked at 11:45.

Black Swan Event: The Biggest Crypto Market Risk!In today’s article, we will be discussing a risk known as Black Swan Event. Now what is the Black Swan and why it is considered as the most unexpected event in the course of any economic crisis is the greater factor to be discussed.
The most unexpected event that has the maximum possibility to occur in the market is called Black Swan, this term was first coined by NYU professor and economist Nassim Nicholas Taleb.
The main attributes that shape the possibilities of Black Swan events:
Unpredictability
Potential Severities
Widespread impact
According to Taleb:
A black swan is an unpredictable event that is beyond what is normally expected of a situation and has potentially severe consequences.
They are impossible to predict due to their extreme rarity, yet have catastrophic consequences, it is important for people to always assume a black swan event is a possibility, whatever it may be, and to try to plan accordingly.
Some believe that diversification may offer some protection when a black swan event does occur.
Black swan events are characterized by their extreme rarity, severe impact, and the widespread insistence they were obvious in hindsight.
Extrapolating, using statistics based on observations of past events is not helpful for predicting black swans, and might even make us more vulnerable to them.
The last key aspect of a black swan is that as a historically important event, observers are keen to explain it after the fact and speculate as to how it could have been predicted. Such retrospective speculation, however, does not actually help to predict future black swans as these can be anything from a credit crisis to a war.
What is the impact on Institutional markets?
We know that somehow, we can use normal factors of prediction and probability over mass numbers of people like the result predicting based on Normal distribution curve, for such things, even the extrapolation method is not working.
Hence Black Swan can take the market in any form that is not predefined, that can attack a market with several forms like crashing of prices and regulatory risk of digital exchanges.
What are the two different types of Black Swan risk?
Black Swan occurs within two types one is the positive impact and another one is a negative impact, now the inability to predict the accurate possibilities is the driving force behind the execution of the Black Swan event.
Any clampdown on the trading of cryptocurrencies and other digital money can directly crash the prices of other currencies.
The crackdown of Cryptocurrency exchanges by any third parties or other factors can also be counted as the Black Swan effect, many particular exogenous events can be forced to occur like:
Inverse Volatility
The crackdown of Crypto exchanges
Regulatory risk of Crypto exchanges
Low liquidity and low trading volume
Having said that, 2022 has been the year of the “Black Swan” throughout the world of cryptocurrency. From the fall of LUNA to the insolvency of 3AC, Celsius, FTX and now BlockFi, the market has taken major hits in value and credibility. Each one of these events seemingly was viewed as a once in a lifetime event.
To sum up, the Black Swan event is described in the following summarized manner:
This event is so rare that it has many unknown possibilities occurring suddenly.
Also, the impact is so huge that it can have a catastrophic effect.
The hindsight conclusion if the prediction comes as true.
Conclusion
At last, one could conclude that many events could turn into a Black Swan in crypto trading such as, Network Congestion where everyone is rushing to have Ethereum and it subsequently raises the price of gas.
In this case, when Black Swan occurs, the problem increases tenfold times and also this affects the liquidation process and also low-value transfers can simply attack the blockchain system.
If you liked it, make sure to support with a like, follow and a comment!
Best Regards, CryptoQueens.

GBP/JPY Long Opportunity- FEBRUARY RECAPExplanation with the chart - looking at market structure (HHs and HLs) with clean price action - anticipating bullish momentum for pre-London session. Risking 1.5%.

CAD/CHF: Incoming break out inminentI follow this par to long position. As I trade in the direction based in the strong key in market structure.
We're in some minutes to closed up the candlestick in H4 timeframe, what if this will bring us a bullish signal, this will be a good signal to buy.
Now, to be quickly, I see that we identify a smart point in the yellow zone that I draw in H4 timeframe very well, that mean a bullish signal, as this trade I was in long and hit my SL in $0.6880 CHF in my first trade, I re=entry in this second trade as i still in bullish. The only thing it's work a little more the precision in the entries as first I enter in the first big candlestick in H1 timeframe to long, but hours later, drop a little and hit my Stop Loss. what this form a bullish channel flag in H1 timeframe. So guys, we're still in long and there's an opportunity to entry early in long position
So, we hope that CAD going to our trajectory in my analysis. Take profit update to $0.6968 CHF. And SL in $0.6859 CHF.
Good luck!!!
Good luck,

GBPCAD Long Opportunity - JANAURY RECAP (BE)Left money on the table - price rejected BE zone and SL triggered at BE.

GBP/CAD: UpdateAs GBP/CAD hit my Stop Loss in my yesterday trade when I was shorting in $1.6492 CAD, i knew in the market structure that it's a bearish setup, and then I decide to entry in the short position again in the higher price like $1.6567 CAD in the market price, what hours more later, GBP/CAD drop significantly as I knew it based in my parameters, So, I will qualify this trade like pretty excellent, but the only thing it's the entry in the price and how to take action when closed up our position when it's a market trap or maybe a continuation in the trend that we may to know it as professional trader.
Now, look in H4 timeframe one detail that I add in this update, we see a smart point that I draw in H4 timeframe in the yellow zone that Identify our smart point to sell. Also, in my previously analysis in GBP/CAD when I re-entry in short in my comment box that I write down that i identify very good a short in this zone, a formation of break out using and drawing a diagonal line, the price action very good, and also, the only detail it's add this zone why was important to add here.
Now, if you follow my analysis, notice that we're in profit over almost 200 pips earned in this trade. What this was an amazing drop that a lot time I don't catched an entry like this. But now, I update my target profit that I want to eat my all target until $1.6128 CAD, That will be my great target that I can to get 440 pips in this single trade. What I down my target profit for this level based in H4 timeframe, we have a huge potential in this par. And also, I put a break even to $1.6506 CAD to protect my pips in profits.
So guys, if you're shorting GBP/CAD and follow my analysis as always, we can to grow up our community that it's big in my number of followers in my social media.
Remember that tomorrow we have our big event in United States about the U.S. interest rate decision and what FED will do in our global financial market when tomorrow reflect their result in investing. What based in my analysis, Federal Reserve starting to downturn their interest rate, what we hope that U.S. Dollar continue bearish in this way.
Have a good night!!!

GBPJPY - 4 HR Projection and Analysis Just a couple of options i have drawn out for GJ. There are obviously many more ways price can move here. But these are just the main couple i am anticipating.
Also note that the depths and amounts of retracements may vary - making it seem that there are way more options for price to travel but they are all pretty much the same - As long as the direction continues in the same manner and the pullbacks react at significant areas, i am not too worried.
As long as my anticipated direction and behavior reflects the actual behavior on the charts, I am not fixated on price hitting the exact numbers like 158.500 etc. I just have those as a rough guide or area.
When price hits those areas i will then readjust and re-assess my perspective and analysis. 😊

AUD/JPY BUY NOW 320 PIPsSo from last week breakdown analysis we see now a nice confirmation of a double bottom and price is now respecting previous resistance now is support and we see a nice rejection
Check below for the previous explanation
Follow me for more update

EUR/JPY BUY NOW 400 PIPSWe broke down last wee, the setup of EUR/JPY and we now have a nice confirmation for an entry, nice bullish candlestick. with high momentum
Click below to see the explanation for the EUR/JPY
Follow me for more updates

AUD/USD: Possible correction to watchAussie look bearish from this point, but after this bull trend. Aussie look a potential correction from this point toward yellow zone, what it's the smart point to buy, but institutional will make all possible to take a lot liquidations about long position. What you will need to take carefully, it's very surely that Aussie will experiment a correction to $0.7060 USD. a nice opportunity to short there.
Beware with long position!!! Wait a little more until I identify very well in the Sydney session any bearish signal there.
I will keep update this par, it's a nice opportunity to short!!!

GBP/CAD: bearish market structureIn this new analysis, as I was in long in GBP/CAD, I see very clear a bearish movement that may GBP difficult to climb. But in this zone, the price it's below of the EMA 200 and we can to develop a new bearish cycle based the Elliot Wave Cycle in H1 timeframe
This could be the next movement in H4 timeframe based the market structure and price action. And also, this grey zone could to help identify nice entries if we develop a nice strategy in Forex market for this week in GBP/CAD
Trade Information:
1) Position: Short
2) Entry Price: $1.6494 CAD
3) Stop Loss: $1.6558 CAD (64 pips)
4) Take Profit: $1.6316 CAD (177 pips)
Good luck!!!

True SMC entry module to pass Funded Accounts!!!Hello traders. In this module we aim to explain how to enter the trades along with market makers for high RR entries. Entering like this will protect your Stoploss since your orders are along with the Market makers and market makers defend their positions. As a result your position in also defended in this case. Please pay attention to the annotations made on the chart.
Happy Trading
Team Lamda!!!


GOLD Intraday Analysis - ( 27 Jan 2023 ) Gold took a melt down of about 200 pips from the double top formed at 1948-1950 region. Shorts were planned out as per analysis below 1934 key level backed with fundamental data released yesterday. Despite the melt down as shown yesterday with very strong GDP data, there is still no confirmations of market shift. All time frame shows no shift in structure and will be playing the bullish bias on GOLD.
HRHR buys at 1923 key level
MRMR buys at 1929 key level
Safest buys at 1939.5 key level
However i will only look for sells below the daily zone whereby a new low will be created and there will be a potential shift in structure only below 1912.

Hope this video bless you!keep forex simple and dont do short cuts in your journeys stay in process in learning your only forex strategy don't keep changing it will create confusing and only have couple pairs tat you are willing to learn! God bless you stay safe
