Cardano - Focus On This One Altcoin!Cardano ( CRYPTO:ADAUSD ) will lead the bullish rally:
Click chart above to see the detailed analysis👆🏻
It really seems to be unbelievable but Cardano is 100% repeating the previous cycle which we saw back in 2018. A double bottom neckline breakout, followed by a significant rally and another break and retest and Cardano is now clearly heading towards the previous all time high.
Levels to watch: $0.6, $2.5
Keep your long term vision,
Philip (BasicTrading)
Marketstructure

CAD JPY Trade Setup 1 hour timeframe CAD JPY Trade Setup 1 hour timeframe
Following last week's trade setup CAD JPY is moving in an uptrend making Higher Highs and Higher Lows, so we will keep looking for Buying opportunities.
CAD JPY is forming a bullish break and retest continuation pattern that also align with the 0.618-0.50 Fib Retracement level.
Lets wait for the price to pull back to the retest level then enter base off candlestick confirmation

GBPUSD – Bearish Setup Forming | Fair Value Gap Rejection PlayThe 4H chart on GBP/USD shows a clean bearish market structure, with price currently in a corrective phase after recent downside momentum. A Fair Value Gap (FVG) has been identified between the 1.29700–1.30000 range, which acts as a key supply zone for potential short setups.
📊 Technical Breakdown
1. Fair Value Gap (FVG)
A visible imbalance was left after an aggressive bearish move—marked in the yellow zone.
Price is expected to retrace into this inefficient zone to fill orders before continuing downward.
The anticipated entry for shorts is around 1.29798, near the midpoint of the FVG.
2. Bearish Market Structure
Lower highs and lower lows dominate the current structure.
The bounce is corrective in nature and lacks momentum, indicating a potential bull trap.
Expecting a short-term retracement up to the FVG zone, followed by a continuation to the downside.
3. Target Zone
Target: 1.28042 — this level sits just above a previous demand zone, making it a natural TP1.
This area also overlaps with previous price reactions, giving it high confluence.
🧠 Trade Idea
Entry: ~1.29798 (within the FVG)
Target: 1.28042
Risk Management : A stop loss above 1.30000 or above the upper boundary of the FVG to account for false breaks.
Rationale: Risk-reward is favorable due to tight invalidation zone and strong downside continuation probability.
⚠️ Key Notes
Watch for confirmation at the FVG zone such as bearish engulfing or lower timeframe break of structure.
If price breaks above 1.3000 and holds, the idea will be invalidated.

USDJPY SELL SETUP!!From a technical perspective, examining the USD/JPY chart, we might notice that prices are forming a lower high, which often indicates a potential downtrend. The price respecting Fibonacci retracement levels can also suggest that the market is reacting to key support and resistance levels. When traders see the price approaching these levels and behaving predictably, it can bolster their confidence in the direction of their trades.
Overall, the expectation is for a continuing strength in the yen, especially if the market sentiment remains focused on potential rate hikes from the Fed. This scenario might lead to more bearish moves for the USD/JPY pair, making it important to watch for any significant economic data releases or comments from central bank officials that could signal changes in monetary policy.

BTC ZonesHere are my simplistic zones that price has been respecting and will most likely follow. Do you think Bitcoin will pull down to the support levels below?
I see price making a slight move towards the support levels then contesting resistance for new highs. Based on history, we know how crypto tends to move in these months. COINBASE:BTCUSD

AUDUSD BUY NOW 120 PipsLooking at the monthly charts, it seems like we've hit a key level where the price has bounced back up nicely. This indicates a shift in the overall trend, making it look like there's potential for some upward movement. Since the DXY (which tracks the strength of the dollar) is weakening, we might be able to ride this wave up and take advantage of the positive momentum in the market. It’s all about following the trend and going with the flow!
Risk to reward is very lovely
Follow me for your support
Thank You

USDCHF BUY NOW!!Nice wyckoff distribution, we can see price now heading higher, structure indicate buying pressure is coming in the market!!!
Nice risk to reward!!! see you later

Gold (XAUUSD) - Liquidity Grab & Potential ReversalGold has been showing interesting price action around key levels, forming a potential double top structure. The market tested the 2,930.19 resistance level, rejecting it sharply and showing signs of exhaustion.
Possible Scenario:
- Point A : Price is currently reacting from a key resistance level where liquidity is stacked.
- Point B : A potential sweep of liquidity around 2,874.04 , where price could create a demand zone before reversing.
- Point C : If buyers step in after the liquidity grab at B, we could see a rally back into the resistance zone, targeting a break of 2,930.19 .
However, if the structure breaks lower without a strong buyer reaction, further downside could come into play, possibly targeting 2,820 as the next liquidity zone.
Key Considerations:
- Monitoring fundamental catalysts such as economic data and interest rate decisions. With NFP and Fed updates this week, volatility is expected!
- Watching for confirmation of bullish intent after the liquidity grab.
- Tracking volume to gauge potential momentum.
🚀 Do you think gold will hold above 2,874.04 , or will bears take over? Drop your thoughts below! 🚀
#Tradingview
FOREXCOM:XAUUSD

3 Trades I'm Taking With My Robin Trap Set Up Right NowMe Going Over 3 Trade Ideas That Im Taking Right Now.

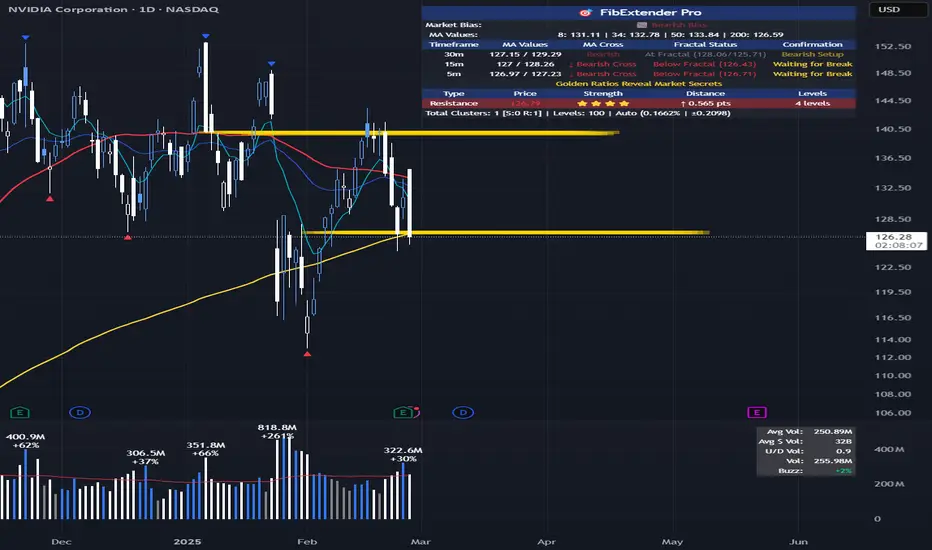
NVDA: Fibonacci cluster support and 200MA at 126.5. NASDAQ:NVDA : Fibonacci Cluster Support at 126.5 Sets Up Potential 10% Rally to 140
Looking at NVIDIA's technical setup, I've identified a critical support zone that could launch NASDAQ:NVDA toward a significant target if it holds.
Technical Analysis
The current price action shows NVIDIA testing a key support zone consisting of:
- Fibonacci cluster at 126.5
- 200 Moving Average support
If this support zone holds, I'm targeting the next Fibonacci cluster at 140, representing approximately a 10.7% upside potential.
Entry Strategy
I'm monitoring two potential entry scenarios:
Aggressive Entry (15-minute chart):
- Wait for 8 EMA to cross above 34 EMA
- Price must break above the most recent swing high
- Entry on confirmation of this break
Conservative Entry (30-minute chart):
- Same criteria as above but on the 30-minute timeframe
- Provides more reliable signals with fewer false breakouts
Risk Management
Stop Loss: Place stops below the 126.5 Fibonacci/200 MA support zone (approximately 124-125)
Profit Target: First target at the 140 Fibonacci cluster
Conflicting Indicators
My analysis shows mixed signals that require caution:
1. My WillVall indicator on the weekly chart shows a potential buy opportunity at current prices, BUT it needs to change direction and move above the 15 level before confirming a long-term entry
2. Multiple timeframe squeeze indicators (Weekly, 4D, 3D, 2D) are currently in squeeze with negative momentum, suggesting downside pressure
3. According to IBD Market School methodology, the market is showing signs of correction and the buy switch is currently OFF, indicating we should avoid new long positions
Trade Plan
Given the current market conditions and mixed signals:
- Wait for confirmation of support at the 126.5 zone
- Look for entry signal confirmation on preferred timeframe
- Use smaller position size due to conflicting indicators
- Set clear stop loss below support (124-125)
- Target the 140 Fibonacci cluster for profit taking
I'll remain patient and wait for clearer market conditions before committing significant capital to this trade. The technical setup is promising, but broader market conditions suggest caution.
Robin Trap strategy 2/27/25 Me Going Over My Funded Accounts And Challenges. And How I Use My Robin Trap Strategy To Grow Them

Tesla - Elon Is Playing The Charts!Tesla ( NASDAQ:TSLA ) is perfectly respecting structure:
Click chart above to see the detailed analysis👆🏻
Two months ago Tesla perfectly retested the previous all time high resistance and closed with a massive rejection wick. This means that a correction - which is currently happening - is expected and after the bullish break and retest, we will then finally see new all time highs.
Levels to watch: $280, $400
Keep your long term vision,
Philip (BasicTrading)

btc"🌟 Welcome to Golden Candle! 🌟
We're a team of 📈 passionate traders 📉 who love sharing our 🔍 technical analysis insights 🔎 with the TradingView community. 🌎
Our goal is to provide 💡 valuable perspectives 💡 on market trends and patterns, but 🚫 please note that our analyses are not intended as buy or sell recommendations. 🚫
Instead, they reflect our own 💭 personal attitudes and thoughts. 💭
Follow along and 📚 learn 📚 from our analyses! 📊💡"

GOLD UPCOMING TREND READ IN CAPTIONThis 4-hour chart of Gold (XAU/USD) shows a recent pullback from the resistance level at 2,920.364, with a key support zone around2,847.153, highlighted as a buy zone. Fibonacci retracement levels are also shown, with the price currently testing the 0.382 level at 2,871.969. The chart suggests a potential retest in the area between2,887.470 and $2,890.000 before a possible bounce toward higher resistance levels. The breakout above the recent high could lead to further gains, but a pullback toward support levels is expected first

AUDUSD Buy zone. After Market structure shift in 4H and Daily shift now price is taking a way down to the point of interest (liquidity zone) in this zone there is 4H liquidity engineer as well as five minute Liquidity Engineer.
The price is predicted to tap into liquidity engeneer and move to the bullish direction.
The trade can be taken directly, or one can wait for change of structure in lower time frame and enter.
I wish you all the best.

EURUSD Intraday Move -LO Liquidity grab
-61.8 Retraement
-HTF divergence
-LL LH - Change in structure!
Looking to exit preferably before the NY Session
ADR LOW coincides with VPOC (TP) heavy support area with resting liquidity.

GBPUSD OUTLOOK.Market Structure Break Down.
1) Weekly- In this timeframe, the main structure is Bearish. Creating LH & LL. The price pulls back before long-term continuation unless it breaks the structure at 1.28000. The current candle is unidentifiable.
2) Daily- Market Structure is bullish creating HH & HL. Therefore, only buy setups we oat to look for on the lower-timeframe.
3)4H- Market structure is showing a clear bullish trend. However, the price has been consolidating since the market opened for the week. Before the Bullish continuation, expect liquidity grabs at 1.25000.
I am waiting for the price to break the 4H range and then wait for an entry confirmation.
Feel free to comment your thoughts on this breakdown.

2025 ICT Mentorship: Institutional Market Structure Part 22025 ICT Mentorship: Lecture 3_Institutional Market Structure Part 2
Greetings Traders!
In Lecture 3 of the 2025 ICT Mentorship, we dive deep into the core principles of market structure, focusing on how institutions truly move the market. Understanding this is essential for precision trading and eliminating emotional biases.
Key Insights from the Lecture
🔹 Distinguishing Minor vs. Strong Swing Points – Learn to differentiate between structural noise and true market shifts.
🔹 Marking Market Structure with Precision – Objectively analyze price action to refine your decision-making process.
🔹 Institutional Market Structure Techniques – Align with smart money to enhance accuracy and consistency.
Why This Matters
Mastering market structure allows traders to anticipate price movement, reducing impulsive trades and reinforcing a disciplined approach. By integrating institutional strategies, we position ourselves for more accurate and confident executions.
Stay focused, keep refining your skills, and let’s continue elevating our trading game.
Institutional Market Structure Part 1:
Enjoy the video and happy trading!
The Architect 🏛️📊

The Market Matrix - Gold, DXY, SP500 & Crude Oil Feb 16 2025This weeks edition of the market matrix.
How I'm looking to participate in the Gold, DXY, SP500 & Crude Oil markets this week.
I throw in some COT analysis as well.

Crude Oil - Ichimoku Theories + Price Action ConceptsNYMEX:CL1!
Combining your Ichimoku strategy, with market structure orderblocks, could provide you with support & resistance levels, for your Ichimoku trend bias.
- Here is Crude Oil futures, on a 4H timeframe
- Analyze how the orderblocks, provide key level resistance, for your short positions

GBPUSD WEEKLY OUTLOOKThe daily timeframe market structure is showing a clear bearish trend. Price has failed twice to break the last low high to create a new trend. Therefore, the trend remains bearish and we should only look for sells.
However, on the 4H timeframe, we do not have a clear confirmation on which direction the price wants to move. Yes, we have the long-term trend, but the market is not yet set up on the lower timeframe. Price have been ranging from Jan 27th to the present day. We shall wait for a clear BOS on the 4H timeframe before we look for an entry.

Institutional Market Structure: How to Mark It!2025 ICT Mentorship: Lecture 2
Video Description:
📈 Unlock the Secrets of Institutional Market Structure!
Hey traders! Welcome to today’s video, where we lay the foundation for mastering how the market truly moves. Understanding market structure is the key to improving your trading precision and analysis.
In this session, we’ll break down the difference between minor swing points and strong swing points—a crucial distinction for objective and accurate structure analysis. You’ll learn how to mark market structure properly, keeping emotions in check and aligning with solid trading psychology.
🎯 What You’ll Gain:
✅ Identify market structure like a pro
✅ Enhance your objectivity and reduce impulsive decisions
✅ Master institutional techniques for improved accuracy
If you’re ready to take your trading to the next level and build a strong foundation, hit play and let’s dive in!
💬 Don’t forget to like, comment, and subscribe for more game-changing insights. Share your thoughts below—I’d love to hear how this helps your trading journey!
Enjoy the video and happy trading!
The Architect 🏛️📊

BTC - The DreamBINANCE:BTCUSDH2025
We are holding strong at these levels.
It's ok to dream, dream big.
We came through some rough years, so no giving up now!
Let see these continuous bullish measured moves.
Break above 110k and hold steady from there.
Trade smart, trade safe...
HODL ON!
