$ONDO: Ondo Finance – Tokenizing the Future or Facing Roadblocks
(1/9)
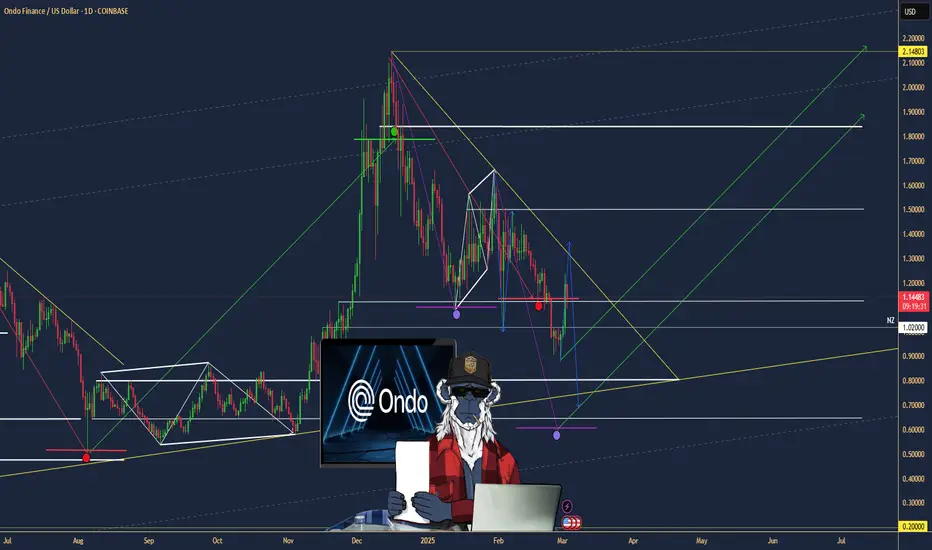
Good morning, champs! ☀️ LSE:ONDO : Ondo Finance – Tokenizing the Future or Facing RWA Roadblocks?
Ondo Finance just joined Mastercard’s Multi-Token Network, aiming to tokenize U.S. Treasuries! But with market volatility, is this RWA gem a buy or a wait? Let’s dive in! 🔍
(2/9) – PRICE PERFORMANCE 📊
• Recent Trend: Transaction volume spiked to 400M in Jan 2025, now ~300M 💰
• Market Insight: Up 1.6% recently (Daily Hodl, Feb 2025) 📏
• Sector: RWA tokenization surging with TradFi interest 🌟
It’s buzzing in the DeFi space! ⚙️
(3/9) – MARKET POSITION 📈
• Market Cap: Not specified; holds 40% of tokenized securities market 🏆
• Holdings: U.S. Treasuries, bonds via USDY, OUSG tokens ⏰
• Trend: Whales hold 88% of tokens, per IntoTheBlock 🎯
Firm, leading RWA tokenization! 🚀
(4/9) – KEY DEVELOPMENTS 🔑
• Partnership: Joined Mastercard MTN as first RWA provider (Feb 26, 2025) 🔄
• Expansion: Teamed with World Liberty Financial for RWAs 🌍
• Market Reaction: Steady growth in transaction volume 📋
Adapting, bridging TradFi and DeFi! 💡
(5/9) – RISKS IN FOCUS ⚡
• Volatility: Crypto market swings could hit token value 🔍
• Regulation: Compliance hurdles in tokenized assets 📉
• Concentration: High whale ownership (88%) risks dumps ❄️
Tough, but risks loom! 🛑
(6/9) – SWOT: STRENGTHS 💪
• RWA Leader: 40% tokenized securities market share 🥇
• Big Backers: BlackRock, Coinbase Ventures support 📊
• Tech Edge: Tokenizing U.S. Treasuries for DeFi 🔧
Got fuel in the tank! 🏦
(7/9) – SWOT: WEAKNESSES & OPPORTUNITIES ⚖️
• Weaknesses: High whale concentration, market volatility 📉
• Opportunities: TradFi integration, DeFi yield growth 📈
Can it tokenize to the moon? 🤔
(8/9) – 📢Transaction volume at 300M, Mastercard partnership live, your take? 🗳️
• Bullish: $2 soon, TradFi loves it 🐂
• Neutral: Steady, risks balance ⚖️
• Bearish: $0.90 looms, whales dump 🐻
Chime in below! 👇
(9/9) – FINAL TAKEAWAY 🎯
SMCI’s transaction volume and TradFi ties scream potential 📈, but whale concentration adds caution 🌿. Volatility’s our buddy—dips are DCA gold 💰. Grab ‘em low, climb like pros! Gem or bust?
Markettrends
$SMCI: Super Micro Computer – AI Server Surge or a Pit Stop?
NASDAQ:SMCI : Super Micro Computer – AI Server Surge or a Pit Stop?
AI infrastructure’s hotter than a July barbecue, with revenue up 110% to $14,989.2 million in 2024! But with internal control concerns, is this tech beast charging up or taking a breather? Let’s dive in!
(1/9)
Good morning, everyone! ☀️ NASDAQ:SMCI : Super Micro Computer – AI Server Surge or a Pit Stop?
AI infrastructure’s hotter than a July barbecue, with revenue up 110% to $14,989.2 million in 2024! But with internal control concerns, is this tech beast charging up or taking a breather? Let’s dive in! 🔍
(2/9) – PRICE PERFORMANCE 📊
• Fiscal 2024: Net sales soared 110.4% to $14,989.2 million 💰
• Server Systems: Up 115.9%, GPU servers leading the charge 📏
• Sector Trend: AI demand’s skyrocketing 🌟
It’s a wild ride, fueled by AI’s hunger! ⚙️
(3/9) – MARKET POSITION 📈
• Market Cap: $2.4B, based on shares outstanding 🏆
• Holdings: Servers, storage, and AI solutions ⏰
• Trend: International sales steady at 32%, showing global appetite 🎯
Firm, carving a niche in AI infrastructure! 🚀
(4/9) – KEY DEVELOPMENTS 🔑
• 10-K Filing: Dropped Feb 25, 20
25, dodged NASDAQ delisting 🔄
• Revenue Driver: GPU servers for AI workloads 🌍
• Market Reaction: Shares jumped 19.8% after-hours 📋
Adapting, with investors cheering the comeback! 💡
(5/9) – RISKS IN FOCUS ⚡
• Internal Controls: Audit flagged issues, per Feb 25 filing 🔍
• Competition: Big players in AI server space 📉
• Volatility: High-growth sectors swing hard ❄️
Tough, but risks loom! 🛑
(6/9) – SWOT: STRENGTHS 💪
• Revenue Boom: 110% growth, $14,989.2 million in sales 🥇
• AI Focus: GPU servers crushing it 📊
• Global Reach: 32% international sales 🔧
Got rocket fuel in the tank! 🏦
(7/9) – SWOT: WEAKNESSES & OPPORTUNITIES ⚖️
• Weaknesses: Internal control concerns, per audit 📉
• Opportunities: AI infrastructure demand keeps soaring 📈
Can it fix the cracks and ride the wave? 🤔
(8/9) – 📢 SMCI’s revenue up 110%, with AI demand exploding, your take? 🗳️
• Bullish: Shares to $50+ soon, AI’s unstoppable 🐂
• Neutral: Steady, risks balance growth ⚖️
• Bearish: $35 looms, controls spook 🐻
Chime in below! 👇
(9/9) – FINAL TAKEAWAY 🎯
SMCI’s revenue surge to $14,989.2 million screams AI potential 📈, but control issues add a pinch of caution 🌿. Volatility’s our friend—dips are DCA gold 💰. Grab ‘em low, climb like pros! Gem or bust?

$LIT: EV's Lithium-Powered ETF – Charging Up or Running on EmptyAMEX:LIT : EV's Lithium-Powered ETF – Charging Up or Running on Empty?
EV demand is up 35% in 2023, and lithium prices are up 8% in 2025 so far. But AMEX:LIT is at $40.82, down from last year. Is it time to buy, hold, or sell? Let's dive in.
(1/9)
Good morning, everyone! ☀️EV demand is up 35% in 2023, and lithium prices are up 8% in 2025 so far. But AMEX:LIT is at $40.82, down from last year. Is it time to buy, hold, or sell? Let's dive in. 🔍
(2/9) – PRICE PERFORMANCE 📊
• Current Price: $ 40.82 💰
• Sector Trend: EV sales globally strong (35% growth in 2023, IEA) 🌟
It’s volatile, with EV growth as a tailwind! ⚙️
(3/9) – MARKET POSITION 📈
• Market Cap: Approximately $ 1.37B (based on $ 40.82 price and 33.5M shares, per Apr 30, 2024, data) 🏆
• Holdings: 40 stocks, top include Albemarle, Tesla (per Global X ETFs) ⏰
• Trend: Lithium demand tied to EV penetration, per IEA data 🎯
Firm, riding the battery wave! 🚀
(4/9) – KEY DEVELOPMENTS 🔑
• EV Demand: Continued rise in 2025, per general expectation and IEA trends 🔄
• Lithium Prices: Mixed, with spot prices varying; ETF at $ 40.82 reflects market conditions 🌍
• Market Reaction: Reflects current market dynamics, no specific Mar 3 data 📋
Adapting, EV surge drives interest! 💡
(5/9) – RISKS IN FOCUS ⚡
• Oversupply: Fears may cap lithium gains, per industry reports 🔍
• Competition: New battery tech could shift demand, per industry reports 📉
• Volatility: Lithium prices historically swing, per Reuters 2023 data ❄️
Tough, but risks loom! 🛑
(6/9) – SWOT: STRENGTHS 💪
• EV Growth: Demand for lithium batteries rising, per IEA 2023 data (35% global sales increase) 🥇
• Diversification: 40 holdings across mining, battery tech, per Global X ETF 📊
• Sector Leader: Exposure to Albemarle, Tesla, per Global X ETF 🔧
Got fuel in the tank! 🏦
(7/9) – SWOT: WEAKNESSES & OPPORTUNITIES ⚖️
• Weaknesses: Price volatility, current price down from last known, oversupply fears 📉
• Opportunities: EV sales growth, potential lithium price recovery based on demand, per IEA trends 📈
Can it capitalize on demand? 🤔
(8/9) – 📢 AMEX:LIT ’s at $ 40.82, EV demand climbing, your take? 🗳️
• Bullish: Price to rise with EV surge 🐂
• Neutral: Steady, risks balance ⚖️
• Bearish: Oversupply or other factors cap gains 🐻
Chime in below! 👇
(9/9) – FINAL TAKEAWAY 🎯
AMEX:LIT ’s EV demand drives potential 📈, but current price at $ 40.82 reflects market caution. Volatility bites, yet dips are our DCA gold 💰. We grab ‘em low, climb like pros! Gem or bust?

BTCUSD: Bearish Pattern Meets Bullish Liquidity – What’s Next?
📉 Bearish Outlook on LTF
On the 12H timeframe, a Head & Shoulders pattern is in play, with a projected target of $59,117.99 . This level aligns perfectly with the liquidity zone on the 4D chart, making it a key area of interest.
📈 Bullish Outlook on HTF
If buyers step in at this liquidity zone ($58,890.48) , BTC could see a second retest of the higher timeframe range before potentially reclaiming bullish momentum toward $146,750.87 .
🔍 Smart Money Perspective:
- A breakdown to GETTEX:59K confirms the Head & Shoulders pattern.
- A strong reversal from liquidity could turn this move into a second retest , fueling a long-term uptrend.
🎯 What’s Next?
Are we seeing a bearish continuation or the foundation for a massive reversal? Share your thoughts below!

Trump Media ($DJT) – Truth Social’s Latest MovesTrump Media ( NASDAQ:DJT ) – Truth Social’s Latest Moves
(1/9)
Good afternoon, TradingView! 🌞 Trump Media ( NASDAQ:DJT ) is trending 📈, last at $ 29.23 per Feb 18, 2025, close (Yahoo Finance), down 3.82% that day. Q4 2024 showed a $ 401M loss, yet cash reserves hit $ 777M 🌿. Let’s dive into this social media play! 🔍
(2/9) – PRICE PERFORMANCE 📊
• Feb 18, 2025: $ 29.23, down 3.82% from $ 30.39 💰
• Q4 2024: Revenue at $ 1M, down from $ 1.1M year prior 📏
• Full Year 2024: $ 3.6M sales, $ 401M net loss 🌟
It’s volatile, with cash as a lifeline! ⚙️
(3/9) – MARKET POSITION 📈
• Market Cap: $ 6.43B as of Feb 18, 2025, per Yahoo 🏆
• User Base: 9M Truth Social sign-ups as of Feb 2024 ⏰
• Trend: Exploring M&A, per Feb 14 filing 🎯
Firm, betting on growth! 🚀
(4/9) – KEY DEVELOPMENTS 🔑
• Q4 Earnings: $ 401M loss reported Feb 14, 2025 🔄
• Expansion: Plans for Truth.Fi ETFs, per Feb 6 Reuters 🌍
• Market Reaction: Flat post-earnings, per CNBC 📋
Adapting, diversification’s key! 💡
(5/9) – RISKS IN FOCUS ⚡
• Losses: $ 401M hit in 2024, per Feb 14 filing 🔍
• Competition: Meta, X pressure social media 📉
• Regulation: Legal woes linger, per Feb 14 SEC ❄️
Tough, but risks loom large! 🛑
(6/9) – SWOT: STRENGTHS 💪
• Cash Reserves: $ 777M buffer, per Feb 14 filing 🥇
• Brand: Trump loyalty drives interest 📊
• Flexibility: M&A plans in motion 🔧
Got resilience in the tank! 🏦
(7/9) – SWOT: WEAKNESSES & OPPORTUNITIES ⚖️
• Weaknesses: Revenue down, losses up 📉
• Opportunities: Crypto ventures, M&A growth 📈
Can NASDAQ:DJT turn cash into wins? 🤔
(8/9) – NASDAQ:DJT ’s $ 23.93 , cash-rich but loss-heavy, your take? 🗳️
• Bullish: $ 35+ soon, M&A pays 🐂
• Neutral: Steady, risks balance ⚖️
• Bearish: $ -20 looms, losses weigh 🐻
Chime in below! 👇
(9/9) – FINAL TAKEAWAY 🎯
NASDAQ:DJT ’s $ 29.23 Feb 18 close masks $ 777M cash stash 📈, but $ 401M losses sting 🌿. Volatility bites, yet dips are our DCA gold 💰. We grab ‘em low, climb like pros! Gem or bust?

Oil ($USOIL) – Diesel Demand Soars as Cold Grips U.S.Oil ( TVC:USOIL ) – Diesel Demand Soars as Cold Grips U.S.
(1/9)
Good morning, Tradingview! Oil is dipping slightly 📉, at $ 74.93, down 0.1% from yesterday’s close, as per February 27, 2025, data. Cold weather’s driving up U.S. diesel demand 💪, and Texas power systems are hitting clean energy milestones 🌿. Let’s dive into this oil play! 🔍
(2/9) – REVENUE PERFORMANCE 📊
• Post-Election: $ 74.93, down 0.1% from $ 75.00 💰
• Feb 27, 2025: Diesel demand rises due to cold weather 📏
• Texas Power: Clean energy milestones achieved 🌟
TVC:USOIL steady, with diesel’s boost! ⚙️
(3/9) – MARKET POSITION 📈
• Market Cap: Approximately $ 1.05B, tracks WTI crude tight 🏆
• Diesel Spike: Cold lifts usage, per Reuters ⏰
• Energy Shift: Texas clean power climbs 🎯
TVC:USOIL firm, frost pays off! 🚀
(4/9) – KEY DEVELOPMENTS 🔑
• Cold Snap: Boosts diesel usage across U.S. 🔄
• Texas Grid: Clean energy marks met 🌍
• Market Reaction: Down 0.1% post-election 📋
TVC:USOIL adapting, chill’s the star! 💡
(5/9) – RISKS IN FOCUS ⚡
• Election Aftermath: Policy shifts may affect prices 🔍
• Green Energy Growth: Challenges oil’s dominance 📉
• Weather Flux: Diesel demand may fluctuate ❄️
TVC:USOIL tough, but risks hover! 🛑
(6/9) – SWOT: STRENGTHS 💪
• Diesel Lift: Cold weather props up demand 🥇
• Oil Core: Fundamental to energy needs 📊
• Resilience: Handles market fluctuations 🔧
TVC:USOIL got heat in the freeze! 🏦
(7/9) – SWOT: WEAKNESSES & OPPORTUNITIES ⚖️
• Weaknesses: Election haze, green energy bite 📉
• Opportunities: Continued cold weather, rising demand 📈
Can AMEX:USO bank on the frost to gains? 🤔
(8/9) – OIL’s $ 74.93 dip, diesel up in Feb 2025, your take? 🗳️
• Bullish: $ 80+ soon, cold lasts 🐂
• Neutral: Steady, risks in check ⚖️
• Bearish: $ 70 looms, green wins 🐻
Chime in below! 👇
(9/9) – FINAL TAKEAWAY 🎯
TVC:USOIL $ 74.93 dip masks diesel’s cold surge 📈, Texas green strides mix it up 🌿. Election stings, yet dips are our DCA gold 💰. We grab ‘em low, climb like pros! Gem or bust?

GOLD (XAU/USD)—$2,975 HIGH SPARKS BUZZGOLD (XAU/USD)—$2,975 HIGH SPARKS BUZZ
(1/9)
Good afternoon, TradingView! Gold (XAU/USD) hit $ 2,975 in Feb ‘25, up 5-7% YTD 🌍 2024’s 26-27% gain shines—here’s the breakdown.
(2/9) – PRICE RISE
• 2024 Gain: 26-27%, best since 2010 📈
• 2025 YTD: 2,955-2,975, 5-7% up 💡
• Feb 24: +0.52% to new high 🌞
Gold’s climb, safe-haven rules.
(3/9) – MARKET MOVES
• Trade Fear: Tariffs spark inflows 🌟
• FASB: Coinbase tie lifts mood 🚗
• Dip: $ 2,940 Feb 25, profit takes 📊
Gold’s humming, tension fuels it.
(4/9) – SECTOR SNAP
• Price: 2,940-2,875, $ 20T+ cap 🌍
• Vs Silver: Outpaces XAG’s wobble 💪
• Forecasts: UBS $ 3,200—value gap? 📉
Gold’s steady, peers falter.
(5/9) – RISKS IN FOCUS
• Fed: High rates cap upside ⚠️
• USD: Tariff boost stings 🔒
• Profit Takes: -1.27% Feb 25 🐻
Gold’s firm, but headwinds nip.
(6/9) – SWOT: STRENGTHS
• Gain: 26-27% ‘24—tough haul 💪
• Demand: Banks, ETFs pile in 🏋️
• Hedge: 4.3% inflation shield 🌱
Gold’s gritty, crisis-proof.
(7/9) – SWOT: WEAKNESSES & OPPORTUNITIES
• Weaknesses: No yield, USD bite 🙈
• Opportunities: Tariffs, $ 3,200 zing 🌏
Can gold vault past the snags?
(8/9) – Gold’s $ 2,975 peak, your view?
1️⃣ Bullish, $ 3,200+ soon 😎
2️⃣ Neutral, Holds, risks linger 🤷
3️⃣ Bearish, $ 2,800 dip looms 😕
Vote below! 🗳️👇
(9/9) – FINAL TAKEAWAY
Gold’s $ 2,975 Feb high and 26% ‘24 stack up, safe-haven star Trade fears lift, risks loom, gem or pause?

COINBASE ($COIN) Q4—CRYPTO CASH PILES UPCOINBASE ( NASDAQ:COIN ) Q4—CRYPTO CASH PILES UP
(1/9)
Good evening, TradingView! Coinbase ( NASDAQ:COIN ) just dropped a Q4 banger 💰 $ 2.27B revenue, up 138% YoY 🌍 Full ‘24 hits $ 6.29B—let’s unpack this crypto hauler!
(2/9) – REVENUE SURGE
• Q4 Take: $ 2.27B 🌟 138% leap from ‘23
• Full ‘24: $ 6.29B 💼 115% climb
• Subs: $ 2.3B 📈 64% jump
NASDAQ:COIN ’s raking it in—trades and fees soar!
(3/9) – EARNINGS POP
• Q4 EPS: $ 4.68 🏆 beats $ 2.11 guess
• Net: $ 1.3B 🌞 300% YoY surge
• EBITDA: $ 3.3B 💪 two years of green
NASDAQ:COIN ’s cash flow hums—profit’s real!
(4/9) – BIG MOVES
• Global Cut: 19% Q4 from overseas 🌐
• Next Up: Derivatives, USDC push 📊
• Stock Dip: Flat post-earn 🤔 profit grabs?
NASDAQ:COIN ’s stretching wide—crypto’s workhorse!
(5/9) – RISKS ON DECK
• Crypto Swings: Price drops sting 🕸️
• SEC Suit: Regs loom ⛔ costs nip
• Rivals: Binance lurks ⚡ tight race
Hot streak—can it sidestep the traps?
(6/9) – SWOT: STRENGTHS
• Haul: $ 2.27B Q4 🚛 volume beast
• Subs: $ 2.3B 💡 steady stream
• Profit: $ 3.3B EBITDA 🏋️ cash stack
NASDAQ:COIN ’s hauling freight—built tough!
(7/9) – SWOT: WEAKNESSES & OPPORTUNITIES
• Weaknesses: Trade lean 🌫️ thin ice
• Opportunities: Global reach 🌏 reg wins
Can NASDAQ:COIN outpace the bumps?
(8/9) – NASDAQ:COIN ’s $ 2.27B Q4—what’s your take?
1️⃣ Bullish—$ 350+ in sight 😎
2️⃣ Neutral—Good haul, risks linger 🤷
3️⃣ Bearish—Crypto dips drag it down 😕
Vote below! 🗳️👇
(9/9) – FINAL TAKEAWAY
NASDAQ:COIN ’s $ 2.27B Q4 and $ 6.29B ‘24 pile up big—crypto hauler 🪙 High P/E, but cash flows—gem or jinx?

CICC ($601995.SS) Q4—CHINA’S IB STAR KEEPS SHININGCICC ($601995.SS) Q4—CHINA’S IB STAR KEEPS SHINING
(1/9)
Good morning, Tradingview! CICC ($601995.SS) is humming—$ 33.108B ‘23 revenue, steady into ‘24 📈🔥. Q4 hints at grit—let’s unpack this finance champ! 🚀
(2/9) – REVENUE HUM
• ‘23 Total: $ 33.108B—up 0.5% YoY 💥
• ‘24 Wealth: $ 6.657B—subset shines 📊
• Trend: X says stable—no big dips
CICC’s ticking—China’s steady glow!
(3/9) – EARNINGS SNAP
• ‘23 Profit: $ 6.107B—down 11.5% 🌍
• Q4 ‘24: X buzzes mixed—details soon 🚗
• Lead: Tops IB, wealth—no sweat 🌟
CICC’s grit holds—market maestro!
(4/9) – BIG MOVES
• Forum: China-Japan ‘24—global zip 📈
• Lead: Equity financing king—steady run 🌍
• No Merge: Solo path shines on 🚗
CICC’s flexing—China’s finance ace!
(5/9) – RISKS IN SIGHT
• China Slow: Demand wobbles—yikes ⚠️
• Regs: Rules tighten—costs nip 🏛️
• Comp: Fintech bites—heat’s on 📉
Solid run—can it dodge the storm?
(6/9) – SWOT: STRENGTHS
• IB Lead: Equity king—top dog 🌟
• Wealth: $ 6.657B—steady juice 🔍
• Global: HK, NY, London—big reach 🚦
CICC’s a steady beast—rock solid!
(7/9) – SWOT: WEAKNESSES & OPPORTUNITIES
• Weaknesses: 11.5% dip—slow zing 💸
• Opportunities: Policy lift, global buzz 🌍
Can CICC zap past the bumps?
(8/9) – CICC’s Q4 grit—what’s your vibe?
1️⃣ Bullish—Value shines bright.
2️⃣ Neutral—Solid, risks hover.
3️⃣ Bearish—China stalls it out.
Vote below! 🗳️👇
(9/9) – FINAL TAKEAWAY
CICC’s $ 33.108B ‘23 and Q4 buzz spark zing—$ 6.657B wealth hums 🌍🪙. China’s ace, but risks lurk—gem or pause?

CITIC SECURITIES CHINA’S FINANCE CHAMP STAYS STEADYCITIC SECURITIES—CHINA’S FINANCE CHAMP STAYS STEADY
(1/9)
Good morning, Tradingview! CITIC Securities is humming—$ 37.7B ‘23 revenue, holding firm in ‘24 📈🔥. Q4 whispers hint resilience—let’s unpack this China giant! 🚀
(2/9) – REVENUE HUM
• ‘23 Segment: $ 37.7B—up 0.5% YoY 💥
• ‘24 Trend: Steady, no big drops—X buzz 📊
• Driver: Banking, investments chug on
CITIC’s ticking—China’s steady hand!
(3/9) – EARNINGS GLOW
• ‘23 Profit: $ 7.1B—up 5.1% YoY 🌍
• Q4 ‘24: X says solid—details soon 🚗
• Lead: Tops China’s IB—no sweat 🌟
CITIC’s grit shines—market maestro!
(4/9) – BIG PLAYS
• Asset Shift: Mgmt. to new arm—efficiency zip 📈
• Market Share: 24.5% A-share lead 🌍
• Global Push: Overseas ops perk up 🚗
CITIC’s flexing—China’s finance king!
(5/9) – RISKS IN VIEW
• China Slow: Demand wobbles—yikes ⚠️
• Regs: Rules tighten—costs nip 🏛️
• Tensions: U.S.-China friction bites 📉
Hot run—can it dodge the heat?
(6/9) – SWOT: STRENGTHS
• IB Lead: 24.5% China share—top dog 🌟
• Profit: $ 7.1B—5.1% growth 🔍
• Focus: New energy bets—future zip 🚦
CITIC’s a steady beast—rock solid!
(7/9) – SWOT: WEAKNESSES & OPPORTUNITIES
• Weaknesses: Profit dip, China lean 💸
• Opportunities: Global cash, stimulus lift 🌍
Can CITIC zap past the bumps?
(8/9) – CITIC’s Q4 grit—what’s your vibe?
1️⃣ Bullish—Value shines bright.
2️⃣ Neutral—Solid, risks hover.
3️⃣ Bearish—China stalls it out.
Vote below! 🗳️👇
(9/9) – FINAL TAKEAWAY
CITIC’s $ 37.7B ‘23 and Q4 buzz spark zing—$ 7.1B profit hums 🌍. China’s champ, but risks lurk—gem or pause?

Chinese Internet Stocks on the Edge: KWEB vs. FXI Introduction:
The Chinese internet sector AMEX:KWEB is at a critical juncture when compared to large-cap Chinese stocks AMEX:FXI . The ratio between these two reflects sector leadership—if KWEB outperforms, it signals renewed strength in internet stocks and suggests the sector is leading.
Current Market Context:
Potential Breakdown: The KWEB-to-FXI ratio is teetering near key support. A breakdown here would be a bearish signal for Chinese internet stocks.
Bullish Outlook: However, bulls are closely watching for signs of outperformance from KWEB, which could indicate the start of a new bullish trend.
Higher-Low Formation: If the ratio forms a higher low relative to its long-term trend, it would be a sign of potential strength in the internet sector.
Key Levels to Watch:
Support: Monitor the ratio’s current support level closely. A breakdown below this could lead to increased selling pressure on KWEB.
Resistance: A breakout above recent highs would indicate renewed outperformance and signal a bullish rotation into internet stocks.
Conclusion:
KWEB is at a make-or-break point, and the coming days could determine its fate. If the sector can establish a higher low and break above resistance, it could signal a bullish shift for Chinese internet stocks. Will KWEB lead, or will large-cap Chinese stocks maintain their dominance? Let me know your thoughts in the comments!
Charts:
(Include a chart showing the KWEB-to-FXI ratio, marking key support, resistance, and any signs of higher-low formations.)
Tags: #KWEB #FXI #ChineseStocks #InternetSector #SectorLeadership #TechnicalAnalysis #MarketTrends #China

AI vs. Software: Is Software Ready to Reclaim Tech Leadership?Introduction:
The rapid advancements in artificial intelligence (AI)—especially with China’s DeepSeek—are reshaping the tech investment landscape. However, with all the focus on AI, could traditional software stocks be staging a comeback?
To answer this, we’re analyzing the Software CBOE:IGV vs. Technology AMEX:XLK ratio, a key indicator of relative strength within the tech sector.
Analysis:
Investment Flow Shift: Over the past few years, capital has largely rotated away from traditional software and into AI-driven sectors.
Bottoming Formation: The IGV-to-XLK ratio appears to have bottomed in June 2024, followed by a steady uptrend.
Breakout Watch: After a strong move in November, the ratio formed a higher low, a constructive sign of strength. Now, it is attempting to break out from a broadening bottom pattern—a significant technical development.
Potential Leadership Change: If this breakout holds and continues higher, software stocks could regain leadership within the tech sector, signaling a shift in investor sentiment.
What to Watch:
Bullish Confirmation: A sustained breakout above resistance would suggest software is regaining dominance within tech.
Bearish Rejection: If the breakout fails, AI-driven themes may continue to overshadow traditional software.
Conclusion:
The software sector appears to be making a strong case for resurgence within tech, especially if this breakout holds. A decisive move higher could mark a major sector rotation back into software stocks, challenging AI’s recent dominance. Will software reclaim its throne, or will AI continue to steal the spotlight? Let’s discuss in the comments!
Tags: #Software #Technology #IGV #XLK #AI #SectorRotation #TechLeadership #MarketTrends

$GOOGL Stocks Sink on Alphabet Earnings; Gold Hits AllTime High Stocks Sink on Alphabet Earnings; Gold Hits All-Time High 📉✨
1/9
Global stocks dipped after Alphabet ( NASDAQ:GOOGL ) missed earnings expectations, putting pressure on Wall Street futures. Investors are now questioning tech's growth outlook. 📉 Could this signal a broader tech revaluation?
2/9
Alphabet’s earnings disappointment impacted sentiment across markets, while some European stocks showed resilience. Novo Nordisk delivered positive earnings, highlighting sector-specific strength. 🏢📊
3/9
Currency Moves: The USD/JPY pair saw notable movement as the yen strengthened. Japan’s wage data came in higher than expected, fueling speculation of another rate hike. 💴 Could this be a turning point for the yen's momentum?
4/9
The dollar weakened against major currencies, driven by Japan’s wage growth data and broader market uncertainty. Currency traders, take note: further BOJ tightening may continue shifting capital flows. 📉
5/9
Gold Surge: The precious metal hit a record high today. A weaker dollar and heightened geopolitical risks are driving investors toward safe-haven assets like gold. 🚀 Will this trend hold if market volatility persists?
6/9
Political surprise: President Trump made unexpected remarks about potential U.S. involvement in Gaza for economic development. Despite the shock value, markets largely shrugged off the news. 🗞️ Investors kept their eyes on the numbers instead.
7/9
Market Insights:
Alphabet ( NASDAQ:GOOGL ): Missed earnings shook tech stocks.
USD/JPY: Yen gains signal a potential shift in forex markets.
Gold: Safe-haven demand pushes prices to new highs.
8/9
Investors may need to reassess their tech positions in light of Alphabet’s performance. Meanwhile, forex traders could find opportunities in USD/JPY movements, and gold investors are riding a bullish wave. 🧭
9/9
What's your market outlook after today's moves? Vote now! 🗳️
Tech will rebound soon 📈
Volatility will dominate 🔄
Gold remains king of 2025 ✨

China's kicked off Year of the Snake: Trade War Meets AI Rally China's Markets in 2025: Trade War Meets AI Rally 🐍📊
1/9
Chinese stocks kicked off the Year of the Snake with mixed signals. Trade tensions with the U.S. are rattling markets, while AI-sector hype led by DeepSeek is lifting tech stocks. 🛑⚡ Will AI innovation outshine trade fears?
2/9
After a holiday break, mainland Chinese markets opened under pressure. The Shanghai Composite Index (SSE $000888) struggled to gain momentum, reflecting concerns over new U.S. tariffs. 📉 Trade wars continue to haunt global markets.
3/9
Meanwhile, Hong Kong-listed Chinese stocks rallied strongly despite tariff risks. Investors remain optimistic about cross-border business resilience and opportunities in tech. 🏢📈
4/9
Currency Stability: The firm fixing of the yuan signals that Beijing is stepping in to manage volatility. Stability in currency markets is crucial for maintaining investor confidence. 💴 Will this intervention calm the storm?
5/9
Trade tensions escalated with new tariffs from the Trump administration. While the measures were less severe than feared, the negative sentiment still weighed on broader market performance. ⚖️ What’s next for U.S.-China trade talks?
6/9
On the upside, the AI sector surged. Buzz around DeepSeek—a rising Chinese AI player—sparked gains in tech giants like Alibaba ( NYSE:BABA ) and Baidu ( NASDAQ:BIDU ). 🚀 AI is becoming a crucial driver of China’s economic narrative.
7/9
Technical Watch:
Shanghai Composite Index (SSE $000888): A bellwether for China's economic sentiment.
CSI300 ($000300): Captures performance across top Chinese blue chips, reflecting key market trends.
8/9
Chinese tech giants like Alibaba and Baidu are riding the AI momentum, but the backdrop of geopolitical and regulatory risks could temper gains. 📊 Can AI innovations outweigh trade turbulence in 2025?
9/9
What’s your outlook on China’s markets this year? Vote now! 🗳️
Bullish: AI-led rally continues 🐂
Neutral: Trade volatility offsets gains ⚖️
Bearish: Trade war worsens 🐻

Wall Street Rallies on Trade Optimism: $SPX Performance Wall Street Rallies on Trade Optimism: S&P 500 Performance Update 📈
1/9
The S&P 500 Index ( SP:SPX ) closed higher today, fueled by optimism surrounding U.S.-China trade negotiations. Energy stocks led the charge, driven by rising oil prices and demand forecasts. 🔋📊
2/9
Energy Sector Surge: Energy stocks played a crucial role in today's SPX gains. Rising global demand and oil price increases are sparking investor confidence. 🚀 Is this trend sustainable?
3/9
Trade Optimism: President Trump's decision to delay tariffs on Canada and Mexico boosted sentiment. However, new U.S. tariffs on China and China's retaliatory measures remain key risks. ⚖️ Trade talks are still a tightrope walk.
4/9
Corporate movers today:
PepsiCo and Estée Lauder fell after weak earnings forecasts. 📉
Palantir soared on a strong revenue outlook. 📈
Earnings season continues to shape sector performance!
5/9
Investors now await Alphabet's earnings, set to drop after market close. Tech giants like Alphabet can significantly impact SPX momentum in coming sessions. Will it be a bullish or bearish catalyst? 🕰️
6/9
Economic Context: The SPX's performance today highlights a market adapting to trade uncertainties. Investors are shifting their focus from immediate trade impacts to longer-term prospects. 💡
7/9
Looking Forward: Alphabet's earnings could either reinforce today's rally or inject new volatility into the market. Tech earnings remain a major influence on overall market sentiment. 🧮
8/9
Today's SPX rally is a reminder of the market's sensitivity to macroeconomic factors—trade policy, sector rotation, and earnings expectations are all in play. Are you positioned for these shifts? 📊
9/9
What’s your market outlook for the SPX this week? Vote now! 🗳️
SPX will continue rising 📈
Expect some volatility 🔄
Bearish pullback ahead 📉

Gold Sector Outlook 2025: Is the Golden Era Just Beginning? Gold Sector Outlook 2025: Is the Golden Era Just Beginning? ✨🏆
Introduction
The gold sector is shining brighter than ever in 2025. With prices climbing rapidly amidst global economic uncertainty and rising geopolitical risks, the precious metal is once again a top choice for investors. But what’s driving this bullish momentum, and what should you watch out for? Let’s dig in. 🕵️♂️💰
Trending Sector Performance
🔍 Recent Sector Highlights
Gold Price Surge: Since October 2023, gold prices have surged 53%, recently hitting $2,801 per ounce. Goldman Sachs predicts a $3,000 target by year-end, while J.P. Morgan is a bit more conservative at $2,600—with room to overshoot. 🚀
Mining Output: Industry forecasts show a potential 17% decline in new gold mining supply over the next five years, signaling tighter future supply. This supply squeeze could fuel higher prices. 📉⛏️
Central Bank Demand: Central banks bought 290 tonnes of gold in early 2024, a sign that institutional demand remains strong. Ongoing debt concerns and geopolitical uncertainty are only amplifying gold’s appeal as a safe-haven asset. 🏦🌎
These data points underscore why gold's momentum might just be heating up.
Sector Valuation 📊
The valuation of key gold mining companies suggests opportunities for savvy investors. Here’s a quick snapshot of forward P/E ratios:
Barrick Gold Corp ( TSX:ABX ): 11.79
Barrick Gold (GOLD): 10.09
Gold Fields ( NYSE:GFI ): 8.01
AngloGold Ashanti ( NYSE:AU ): 7.10
Kinross Gold ( NYSE:KGC ): 12.18
With these valuations below broader market averages, the sector shows signs of potential undervaluation. For long-term investors, this could be a golden opportunity. 💡📈
Risk Assessment ⚠️
Like any investment, gold comes with risks:
Price Volatility: While forecasts remain bullish, economic stability or a stronger U.S. dollar could hurt prices.
Supply Constraints: With fewer new mining projects, gold miners may face production challenges if demand accelerates.
Strategic Sector Analysis 🛠️
SWOT Analysis
Strengths:
✅ Strong central bank demand.
✅ Gold’s status as a time-tested safe-haven.
✅ Potential supply constraints pushing prices higher.
Weaknesses:
❌ High operational costs for mining companies.
Opportunities:
💡 Geopolitical instability driving sustained demand.
💡 Mining innovations creating potential for new exploration.
Threats:
🚨 Economic recovery reducing gold’s appeal.
🚨 Higher interest rates diminishing gold’s relative attractiveness.
Key Trends Influencing Gold Prices 📈
Geopolitical Tensions: Uncertainty continues to steer capital towards safe-haven assets like gold.
Monetary Policy: Rate cuts or looser monetary policy could provide further tailwinds for gold prices.
These factors are expected to keep gold at the forefront of investment strategies throughout 2025.
Accuracy and Data Validity ✅
All insights in this article are based on recent data from financial reports, social media sources, and institutional projections, ensuring relevance for early 2025.
Conclusion 🏁
Gold remains a promising investment for 2025. With central bank demand, potential supply constraints, and persistent geopolitical risks, prices may continue their upward march. However, it’s crucial to stay alert to potential economic shifts that could affect the sector’s performance.
What's your 2025 gold price prediction?
🔺 Above $3,000
➡️ Between $2,600 and $3,000
🔻 Below $2,600
discuss in the comments! We’d love to hear your thoughts.

NASDAQ 100 (NAS100USD): Assessing the Potential BreakoutOver the past few months, the NASDAQ 100 (NAS100USD) has demonstrated a clear upward trajectory, marked by higher highs and higher lows—a classic sign of sustained bullish sentiment. However, we've seen periods of consolidation and recent volatility - let's take a look at its current technical landscape.
Current Market Overview:
As of January 29, 2025, the NASDAQ 100 is trading at approximately 21,600, a level that has served as a significant pivot point in recent trading sessions. A decisive move above this threshold could validate the ongoing uptrend and open the door to further gains.
Key Levels to Monitor:
Immediate Resistance : The 21,600 level is crucial. A sustained break above this point could signal the continuation of the bullish trend.
Support Levels : Should the price retreat, the 21,300 - 21,200 are notable support areas to watch.
Recent Developments:
The market has recently experienced heightened volatility, notably a sharp dip around January 27, followed by an aggressive recovery. This shows how unpredictable the market can be and hints at continued bullish movement.
Strategic Considerations:
Breakout Confirmation : A sustained move above 21,600, ideally accompanied by increased trading volume, would provide stronger confirmation of the breakout.
Support Retest : If the price successfully breaches the 21,600 resistance, this level could transform into a support zone. A subsequent retest of this level as support could present a compelling entry opportunity for long positions.
However , considering the Fed decision and fundamental factors around todays announcement - the most likely scenario would be slightly hawkish or a hawkish pause , which would be somewhat negative for the index. This would allow price to experience a temporary drop back down to the previous support (demand) level of 21,200 before buyers re-engage.
Trading Strategies:
Long Positions on Breakout Confirmation : A clear break and close above 21,600 could signal a long (buy) entry.
Long Positions on Retest of Support : A pullback to the 21,200 support level (assuming it holds) could offer a better opportunity to enter long positions.
Disclaimer:
This analysis is for informational purposes only and should not be considered financial advice. Trading involves significant risk, and it's essential to conduct your own thorough research and analysis before making any investment decisions. Past performance is not indicative of future results. Always use appropriate risk management techniques and trade responsibly. OANDA:NAS100USD IG:NASDAQ PEPPERSTONE:NAS100

Consumer Discretionary vs. Technology: Who Leads in 2025?Introduction:
This week, we’re analyzing two major growth-oriented sectors—consumer discretionary (XLY) and technology (XLK)—to uncover which might lead the market in 2025. The ratio between these sectors offers key insights into their relative strength and momentum, helping investors identify where to find potential outperformance.
Sector Dynamics:
Technology: As the largest and most influential sector in the stock market, tech often drives broader market trends.
Consumer Discretionary: With consumer spending accounting for nearly 70% of U.S. GDP, the health of this sector is crucial for sustained economic growth.
While both sectors thriving is ideal for market strength, discerning the one with stronger momentum is key for alpha seekers.
Analysis:
Recent Performance: Since June, consumer discretionary stocks have outperformed technology, showing short-term strength.
Long-Term Trend: Despite recent outperformance, the longer-term trend in this ratio has been downward, favoring technology.
Key Pattern: The ratio is approaching the resistance of a broadening wedge formation. A breakout above this resistance could indicate unexpected strength in consumer discretionary stocks, suggesting that the consumer may play a larger role in driving growth in 2025.
What to Watch:
Bullish Scenario: A confirmed breakout above the broadening wedge would signal relative strength in XLY, potentially shifting the leadership narrative.
Bearish Scenario: A rejection at resistance and a continuation of the downward trend would reinforce technology’s dominance.
Technology Bullish Play:
Entry: Wait for the ratio to roll over and confirm rejection at resistance.
Target: Position for XLK to regain its leadership role.
Stop Loss: Manage risk with stops above the wedge resistance.
Conclusion:
Both XLY and XLK play vital roles in market performance, but identifying which sector could dominate in 2025 is critical for investors. A breakout in the XLY-to-XLK ratio would signal an important shift in sector leadership, while a continuation of the downtrend reaffirms technology's dominance. Which sector do you think will lead the charge? Share your thoughts below!
Charts:
(Include a chart displaying the XLY-to-XLK ratio, the broadening wedge formation, and key levels of support and resistance. Highlight the short-term outperformance of XLY and the long-term downward trend favoring XLK.)
Tags: #ConsumerDiscretionary #Technology #XLY #XLK #GrowthStocks #SectorLeadership #TechnicalAnalysis

Bank Nifty Analysis:- Sell-on-Rise Opportunity Near 49,900 ZoneHello Everyone, i hope you all will be doing good in your life and your trading as well. Today i have brought an analysis on Banknifty for short term view for few days. First of all let me tell you Banknifty chart is painting a clear picture of a sell-on-rise market . The 49,800-50,000 zone stands out as a strong resistance area, making it an ideal level for initiating short trades. This zone aligns with the broader bearish sentiment, especially after the breakdown of the key 49,000 support, which now acts as resistance. On the downside, 48,215 is the immediate support where a pullback could pause, followed by stronger levels at 47,283 and 46,696 .
Looking at the RSI, it’s nearing oversold territory , which hints at a possible short-term bounce. However, the larger trend still favors sellers. To act on this, short positions can be built near 49,800-50,000 , but make sure to confirm with bearish candlestick patterns like a bearish engulfing or shooting star . For targets, aim for 48,215, 47,283 , and potentially 46,696, while keeping your stop-loss above 50,325 to protect against sudden reversals.
The market’s message is clear that this is a sell-on-rise setup, and patience combined with discipline can lead to high-probability opportunities in this bearish trend.
Disclaimer: This analysis is for educational purposes only. Please trade responsibly and consult a financial advisor before making any decisions.
If you found this analysis helpful, don’t forget to like, follow, and share your thoughts in the comments below! Your support keeps me motivated to share more insights. Let’s grow and learn together—happy trading! 🚀 Also, check my profile for other trading-related ideas @TraderRahulPal .🚀

Beef Prices Soar: A Global Trend Beyond BrazilBeef prices are hitting historic highs across the globe, not just in Brazil, as many tend to believe. The surge isn’t isolated to meat alone; rice, chicken, and olive oil prices are following a similar upward trajectory. This global trend highlights an important point: political factors have minimal influence on price movements in this context. Instead, it’s driven by a complex mix of supply chain disruptions, increased demand, and other economic factors. Understanding these dynamics is crucial. Relying on political narratives to explain price changes is misleading. Stay informed, make data-driven decisions, and don’t fall into political traps that distract from the real issues at hand. Knowledge is your most powerful tool in navigating these challenging times.

Can Market Turbulence Create Future Innovation?In a dramatic turn of events that sent shockwaves through the pharmaceutical industry, Novo Nordisk's recent setback with its experimental obesity drug CagriSema presents a fascinating case study in market resilience and scientific progress. The company's stock plummeted 24% after trial results showed a 22.7% weight reduction efficacy, falling short of the anticipated 25% target. Yet, beneath this apparent disappointment lies a deeper story of pharmaceutical innovation and market adaptation.
The obesity treatment landscape stands at a pivotal crossroads, with the market experiencing exponential growth from its modest beginnings to a staggering $24 billion industry in 2023. Novo Nordisk's journey, alongside competitor Eli Lilly, exemplifies how setbacks often catalyze breakthrough innovations. The CagriSema trial, involving 3,400 participants, represents a clinical study and a testament to the industry's commitment to addressing global health challenges.
Looking ahead, this moment of market recalibration might well be remembered as a turning point in the evolution of obesity treatment. With projections suggesting a potential $200 billion market by the early 2030s, the current turbulence could drive even greater innovation and competition. The fact that only 57% of trial participants reached the highest CagriSema dose points to untapped potential and future opportunities for optimization, suggesting that today's apparent setback might pave the way for tomorrow's breakthroughs.

Risk-On or Risk-Off? Stocks vs. Bonds Introduction:
With stocks reaching new all-time highs and market sentiment edging into euphoria, it's an opportune time to revisit a classic risk-on/risk-off indicator: the ratio between stocks AMEX:SPY and long-term bonds NASDAQ:TLT . This ratio provides a clear view of investor sentiment:
Risk-On: When SPY outperforms TLT, investors favor equities for their higher potential returns.
Risk-Off: When TLT outperforms SPY, it reflects rising risk aversion and a move toward safer assets like bonds.
Analysis:
Uptrend Intact: Currently, the SPY-to-TLT ratio remains in a clear uptrend, defined by a series of higher-highs and higher-lows. This sustained upward momentum signals continued confidence in equities.
Ascending Channel: The ratio is also rising within an ascending price channel, a bullish continuation pattern. As long as this structure holds, the market can be interpreted as firmly in risk-on mode.
What to Watch:
Channel Support: A breakdown below the channel’s lower boundary would be the first sign of caution.
Higher Highs: If the ratio continues to push upward, it would confirm further bullish sentiment in equities.
Conclusion:
The SPY-to-TLT ratio is a key barometer for risk appetite, and its sustained uptrend within the ascending channel is a clear signal of the market’s risk-on posture. As long as this trend holds, equities remain in a favorable position. However, traders should stay vigilant for any signs of a breakdown, which could hint at rising market caution. Are you aligned with this risk-on outlook, or do you see potential cracks forming? Share your thoughts below!
Charts: (Include charts showing the SPY-to-TLT ratio, the ascending price channel, and key trendlines for support and resistance)
Tags: #SPY #TLT #RiskOn #RiskOff #Stocks #Bonds #TechnicalAnalysis #MarketTrends

Red Flag in Tech: SMH vs. QQQ Breakdown Signals Potential Introduction:
Despite the bullish seasonality currently supporting the market, a concerning signal is emerging from a key driver of this stock market rally: the ratio between semiconductors NASDAQ:SMH and the Nasdaq 100 NASDAQ:QQQ . This ratio serves as a critical gauge of tech sector health, as the major tech and AI players fueling this bull market rely heavily on semiconductor innovation.
Analysis:
Tech Sector Health: The SMH-to-QQQ ratio has historically been a strong indicator of tech sector momentum. When semiconductors outperform, it signals strength and optimism in the broader tech sector. Conversely, underperformance by chip stocks raises concerns about the sustainability of tech-driven rallies.
Emerging Concern: Currently, this ratio appears to be breaking down from a rounding top formation—a bearish signal. If this trend persists, it could lead to increased market volatility, potentially as early as year-end or into early 2025.
Market Implications: For the bull market to maintain its momentum, this ratio needs to reverse course soon. Semiconductors are not just another tech subsector—they are foundational to the AI and big tech themes driving this rally. A continued breakdown could dampen market sentiment, impacting broader indices.
Conclusion:
The SMH-to-QQQ ratio is flashing a warning signal, with a potential breakdown that could lead to increased volatility in the near term. However, chip stocks still have time to recover and restore market confidence. This ratio will be a crucial indicator to watch as we approach the end of the year. Will chip stocks regain their footing, or are we headed for a turbulent 2025? Share your insights below!
Charts: (Include relevant charts showing the SMH-to-QQQ ratio, the rounding top formation, and support and resistance levels)
Tags: #Semiconductors #Nasdaq #TechSector #SMH #QQQ #MarketTrends #TechnicalAnalysis
