MARUTI - GO LONG AT 3950 FOR 60% RETURN IN 15 DAYSMARUTI - GO LONG @ 3950 WITH A SL OF 3400 AND A TARGET OF 6500. TARGET SHOULD BE ACHIEVED BY END OF APRIL 2020
Marutisuzuki

MARUTI SUZUKI SPOT CHART CURRENT SWING TARGET-BUYHI EVERYONE!
MARUTI SUZUKI CURRENT LATEST SWING RETRACED AT 0.5 ZONE
GO BUY RIGHT NOW
TARGET 1-6200
TARGET 2-6650
SL-6000
THANK YOU!
KEEP SUPPORTING & HAPPY TRADING

MARUTI SUZUKI DEMAND ZONE- POSITIONAL BUYHI EVERYONE!
MARUTI SUZUKOI IN DEMAND ZONE IN WEEKLY TIME FRAME
BUY ON EVERY SWING LOW DIPS
NOW IT TAKEN A STRONG SUPPORT
GO POSIITONAL BUY FROM HERE
POSITIONAL TARGET-6470
PREFER MONTHLY CE OPTIONS
THANKY YOU!
KEEP SUPPORTING & HAPPY GRADING

Divergence on Maruti Suzuki In Falling MarketExtremely High Risk Trade
Maruti Suzuki Auto Heavy Weigh In Nifty 50 And Sensex 30 Index Showing Divergence on stochastic Indicator
Inverse Head And Shoulder Formation On weekly Chart.
If Gaps up to traps the bear, Shortcovering can be seen in this counter.
Do u your own analysis before trading

Long Maruti for 7700 (Positional Long TF 15 Days)Maruti Is Bullish for 7700 Immediate Target
Testing Live Algo in market Place with 10 Contracts

Another Triangle is ENDING!!!!!!Hey guys, YOu can see that a short triangle is coming to its end in 1H candle chart. So, it is strongly advised to wait tomorrow after opening bell for atleast 2 hours as, prices may be open at a low price or will go down if opened high. Then, we can enter into buy or sell position because a large candle is expected to be formed i.e triangle breakout.
If prices go up buy at 6850 and TP at 6910-6920. If go down sell at 6630 and TP at 6550-6540.

MARUTI SUZUKI BUY SIGNALA buying position is being created in MARUTI for a while now, tomorrow maybe the price opens low but will rally up till the end of the day so 6798 will be the target of tomorrow for Maruti to achieve. SL - 6500 buy at 6530-6540


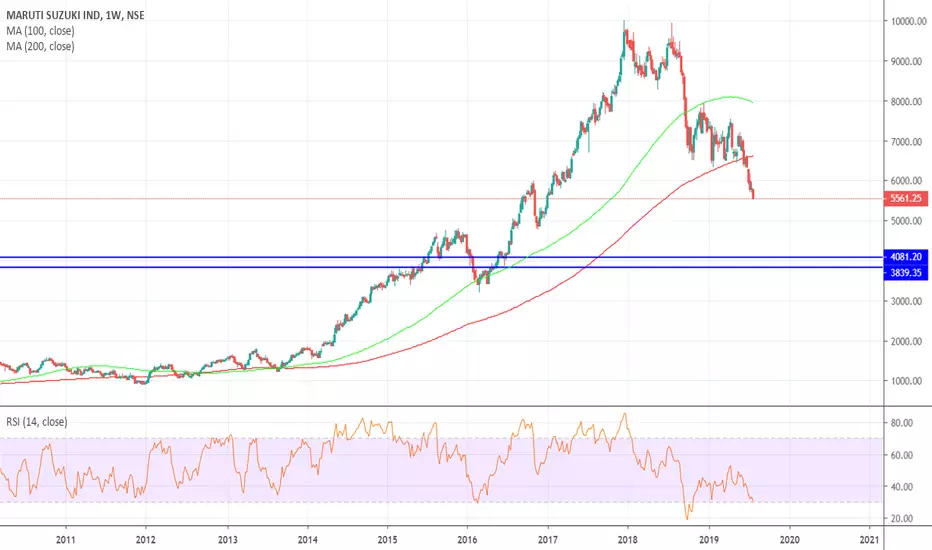
Maruti support level 4081 RsThere are support level for Maruti is 4081. Its just for study purpose. There are no recommendation to buy and sell on the same stock
MARUTI READY for UPMOVE!!!!maruti taking support of long-term trade line
bull above 6100 for 6200,6300,6500 with
bears below 5900 for 5500


A move down on the Daily.Nikkei is now continuing what seems to be the second half of the possible wave C. I am assuming that Nikkei is in a weekly 'Running Flat' pattern, where the C has already started. The last few days was the consolidation for the continuation to the down side. It looks highly likely that Nikkei will go down and make a lower low on the daily . Would it have an impact on NSE:MARUTI ? Well..


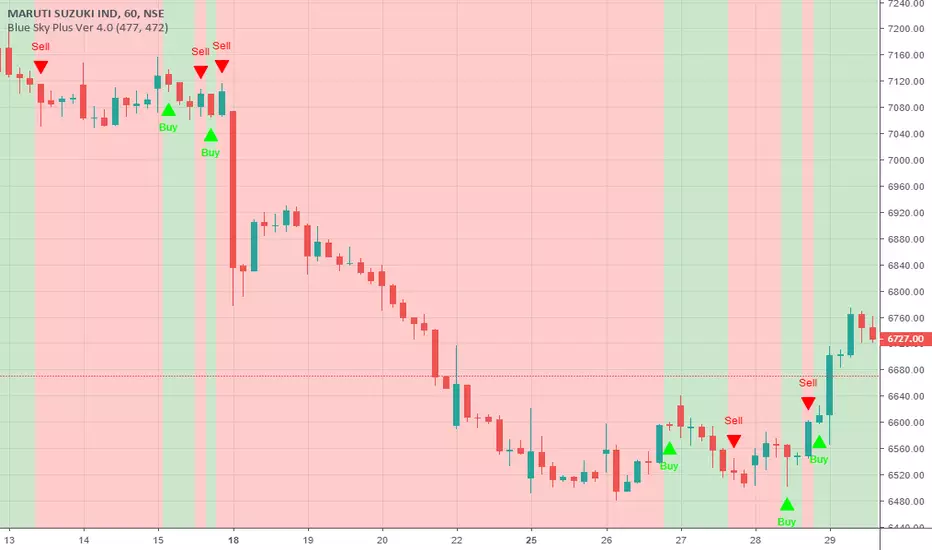
MARUTI MARUTI Trades using Blue Sky Plus Indicator. Spend less time in doing analysis. Just plain follow the indicator. Message or Comment to get a free trial of the indicator.

Maruti Positional Buy Setup for 8000Maruti Has broken the important resistance 7200 on Daily Chart and Closed on Monthly Chart Too. I will accumulate Maruti near 7250-7280 With Stoploss of 7110 For The target of 7600-8000

Maruti Maruti Trades using Blue Sky Plus Indicator. Spend less time in doing analysis. Just plain follow the indicator. Message or Comment to get a free trial of the indicator.
MARUTI - SHORT TERM, MEDIUM TERM AND LONG TERM ANALYSISPLAN FOR MARUTI
1. SELL FOR A TARGET OF 7020 AND A STOPLOSS OF 7540
2. WHEN THE PRICE REACHES 7020, BUY WITH A STOPLOSS OF 6960 AND A TARGET OF 7600
3. SELL AGAIN WHEN THE PRICE REACHES 7600 WITH A SL OF 7800 AND A TARGET OF 6500

Maruti Suzuki - Support,Resistance and targetsPlease check the support resistance for maruti suzuki.

Maruti Suzuki inverted S-H-SMaruti Suzuki has formed an inverted S-H-S pattern and ready rock post 18th Aug/ dividend correction.


MARUTI SUZUKI IND : SHORT CALL Hi friends,
I have work on maruti suzuki 1D chart. We have a descending trendline here. It is declined the fourth time.
The stock may retrace more to touch the previous support line.
- Short : 8965
- sl : 9115
- Target : 8639
***This information is not a recommendation to buy or sell. It is to be used for educational purposes only.***
Always do your own research before entering the trade.
Thank you.

Maruti - Long - Price ActionGood Area to buy as trading and investment.
T1 - 9600
T2 - 10000
T3 - open for investment

#MarutiSuzuki Daily ChartMaruti Suzuki on daily chart, already reacted from demand zone for aggressive trader at 9246 with SL 8990 for an upside target of 9760 RR: 1:2
For defensive trader its a buy at 9150 same SL.
CMP: 9323.95
