Mask

MaskUsdt Analysis Time Frame H4 Date ( 18/January/2023)Entry Zone 2.767
Stop Lose 2.841
Take Profit 2.302

MASK CAN GO UPPERHi, dear traders. how are you ? Today we have a viewpoint to BUY/LONG theMASK symbol.
For risk management, please don't forget stop loss and capital management
When we reach the first target, save some profit and then change the stop to entry
Comment if you have any questions
Thank You

Mask Usdt Time Frame H1 Date (18/January/2022) Mask Usdt Time Frame H1 Date (18/January/2022)
Once Pennant Breakout Got Cleared To The Upside Can Enter And Can Place Sl On Black Line Area Below Pennan


MaskUsdt Analysis Time Frame H1 Date ( 17/January/2023)MaskUsdt Analysis Time Frame H1 Date ( 17/January/2023)
Stop Lose 2.836
Take Profit 2.555
Support 2.728
Supoort 2.547

MaskUsdt Analysis Time Frame H1 Date ( 9/January/2023)MaskUsdt Analysis Time Frame H1 Date ( 9/January/2023)
Resistance 4.360
Resistance 3.865
Resistance 3.358
Resistance 2.984
Support 2.465
Support 1.953
Thankyouu...

MaskUsdt Analysis Time frame H1 Date ( 5 January 2023) MaskUsdt Analysis Time frame H1 Date ( 5 January 2023)
Resistance 2.492
Resistance 2.348
Suppport 2.280
Support 2.132
Support 1.979

MASKUSDT Analysis - 4 JANUARY 2023Hello Guys, Today's Analysis is on the MASKUSDT Symbol in a 15M Time frame, I Hope it Will be Useful for You, Don't Forget to Like, Follow, Comment

TESLA WHATS SHAKING !!!i believe that tesla broke a major support zone and heading down to 65$ area .. its good to wait until that point within next few months then buy it for a long investment
this is not financial advise .. trade on your own risks

MASK/USDT. BitVero Crypto Academy.
Disclamer:
We are not financial advisors. The content that we share on this website are for educational purposes and are our own personal opinions.

#MASKUSDT... Prediction (1/11/2023)#MASKUSDT... Prediction (1/11/2023)
Support 2.020
Support 2.051
Resistance 2.099
Resistance 2.141

DOGE/USD Main trend. Time frame 1 month. Cycles.Logarithm. Time frame 1 month. Main trend. Market cycles. Fractal repetition. Idea for orientation in cycles and where price is in the main trend.
Linear for clarity.
Bad.
The main trend chart shows everything. The price is at an inadequate profit level. At least -93% of the high price is about +2600% of the average accumulation price before pumping 2021.
Good.
1) Bad and good at the same time. Virtually the entire volume of coins is in "Ilon Musk's hands." Anything can be done with the price of the coin under such a monopoly.
2) An army of Twitter followers of the owner in the person of the same Ilon Musk, as before can be directed at the right time with a few unpretentious posts.
3) It is quite likely that together with TWT the DOGE coin will somehow be usefully tied to Twitter, this will positively reflect on the price.
4) When Elon Musk starts his political career, it is very likely that this coin will have an inadequate price tag.
The local area to work is circled . Limit the risks in your work. Be aware of how much of a super profit the price is in.
DOGE/USDT Secondary trend (part). A sideways zone.

$MASK #MASK | LTF LONGPMO and WO are important bounce points, so If you see some bullish breaker on 1H or below, you may think to open a long position.

Mask Long Liking the reaction off of demand zone for $mask along with fib confluence. Looking to run it to the TP1 at the local high. TP2 would be higher supply area and EQ of the gap above. $mask.

MASKUSD Goodtime to BuyMASKUSD followed the descending triangle chart pattern and will likely break through shortly.
It is currently trading at the support, so the most radical decision here is LONG. Now would be a good entry for scalp and swing traders, the target is $3 and more (in case of a breakout), and the stop loss is below the $2 mark. For long-term investors, waiting for a confirmed breakout of either side is much safer.
Long Entry: 2.1x - 2.2x
Tp: $3 - $5
Sl: 1.9x
Still, the crypto market is volatile and low on volume these days. So keeping your betting size lower than usual is a wiser decision. Remember, always trade at your own risk, and never risk more than you can afford to lose.

The MASK Has Fallen! 🤿Hello TradingView Family / Fellow Traders. This is Richard, as known as theSignalyst.
📉 After breaking below the last major low in gray, MASK has been overall bearish trading inside the falling red channel.
MASK is currently approaching a strong daily support in blue 2.0
📈 For the bulls to take over again , we need a break above the upper red trendline AND the last high in gray.
Meanwhile , until the buy is activated, MASK would be overall bearish and can still break the 2.0 downward.
If the 2.0 is broken downward (daily candle close), then a movement till the 1.5 support would be expected.
Always follow your trading plan regarding entry, risk management, and trade management.
Good luck!
All Strategies Are Good; If Managed Properly!
~Rich

MASK/USDT. 1.In this scenario we need to breakdown the triangle and miss the support area, after retest and confirm we can open short to get TP on 0,996.
2. For here we should stay till price come and breakout the triangle and retest it again then we can open long for 6,740 TP.

MASK CAN GO UP AGAINHi, dear traders. how are you ? Today we have a viewpoint to BUY/LONG the MASK symbol.
For risk management, please don't forget stop loss and capital management
When we reach the first target, save some profit and then change the stop to entry
Comment if you have any questions
Thank You

MASK wave count updateI hope you are fine
I think we are in a big flat, where wave b is a triangle, and now we are in wave e of this triangle. After the completion of this triangular wave e, we will have a big drop in the form of a flat c wave
Comment if you have any questions
Thank You


mask set for a big move If we bounce we may see local highs again where we were 2 weeks ago. if we break weekly support level is 40% down.
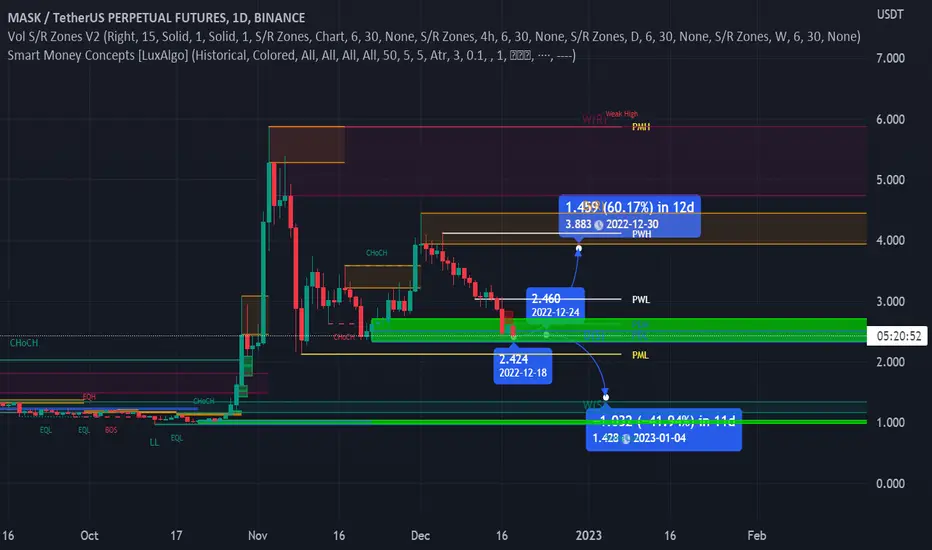
MASK - 12/15 - 4hr Chart UpdateMASK - 12/15
Since Nov 30th MASK is trading in a descending channel towards the major support range of 2.6~2.2.
If it breaks that support it will be a good short opportunity until 1$.
Mostly of MASK pump was related to the Twitter payment integration and right now Twitter is facing tons of problems with a collapse risk.
