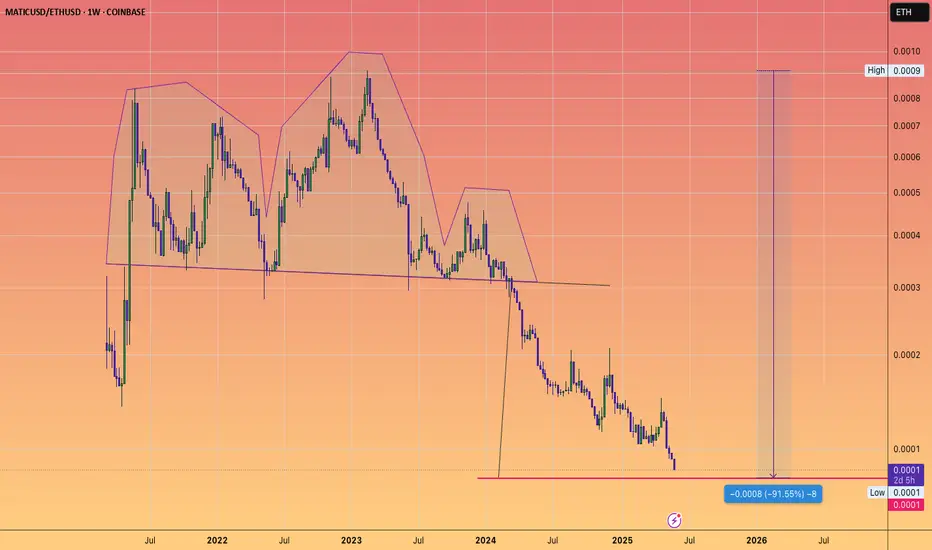
MATIC approaching Head and shoulders target...versus ETH
which would be a -91% loss of value versus the second most important crypto
Matic
Possible bump-and-run bottom reversal over BTC. Polygon/Matic Massive bump-and-run against BTC, it may turn into an interesting entry point for this altseason. Be patient

Polygon's Comeback!#Polygon, a leader of the Ethereum ecosystem since 2019, shows signs of a major comeback after its recent bounce.
Maintaining $0.15 keeps the bullish case valid. Passing $0.28 is the first confirmation, while clearing $0.77 paves the way to target the ATH.
#Matic

MATICUSD - Resistance Flipped SupportSupport has been found along the 200MA on this 4HR chart
This line has previously been seen as an area of strong resistance but now its showing signs of support
This is a sign of further movement up on this 4Hr timeframe

Polygon POL ex-MATIC price analysisIs the price of #POL ex-#Matic starting to wake up?
For those who are new to the crypto market, we will remind you that the last time the price of OKX:POLUSDT grew significantly was back in 2020, and since 2021 it has been in a downward trend.
The main task for #POLUSD buyers is to try to fix the price above $0.30.
📈 Only after this condition is met can a difficult and thorny path of growth to $0.66 open up.
There will surely be many people willing to sell #Polygon along the way, after 4+ years of sitting in a drawdown.
_____________________
Did you like our analysis? Leave a comment, like, and follow to get more

POL: The Return of The Matic#POL recently bounced in what could be a bullish reversal, possibly marking the end of a 3-year corrective major wave (4).
If the $0.151 low holds (stop-loss), a massive bull run shall start for #MATIC.
Passing $0.768 confirms the bullish idea of targeting the ATH.
#Polygon

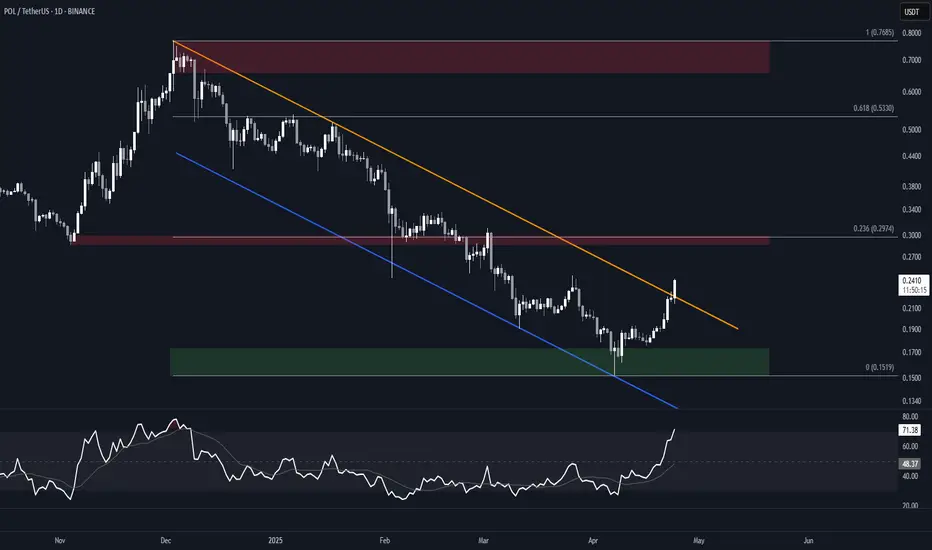
POL (MATIC) Falling Channel BreakoutBINANCE:POLUSDT is attempting a breakout from a nearly 6-months long falling channel. A daily close above the resistance would offer confirmation.
Watch for a potential retest of the resistance as support, as the overbought Daily RSI could signal an imminent pullback.
Key Levels
Aside from the support, these are all good candidates for partial TPs.
• $0.15-$0.17: Bull order block and current support
• $0.30: Previous S/R, 0.236 fib of the move down, and HVN. Will likely offer resistance.
• $0.53: Previous S/R, and 0.618 fib of the move down.
• $0.66-$0.77: Main supply zone, and December 2024 high.
MATICUSD - Weekly MACD Turning GreenFinally the MACD is coming around to the bull side on this Weekly timeframe
This is an indicator that a bull rally is coming out of this deep bear market we have seen
Bullish!

MATIC up ideaan idea suggesting a bull run for matic
matic has been in the bears control for quite awhile
Perhaps it will reverse strongly?
Breakout of channel possible
Weekly timeframe

MATIC/POL buyers beware; bearish signals in the mid-term (1W)The MATIC/POL pair has been dropping for over 1200 days from its peak price, but the structure suggests that a new bullish pattern may have started from the point where we placed the red arrow on the chart.
We’ve marked a supply zone on the chart that could reject the price downwards.
The minimum expectation is for the price to drop to TP1.
The best buying zone for MATIC/POL is the green zone at the bottom of the chart, which could push the price upwards by more than 500%. In fact, it is expected that wave A of the bearish pattern or X wave will end in this area, and the price will enter a mid-term or even long-term bullish phase.
A weekly candle closing above the invalidation level will invalidate this analysis.
For risk management, please don't forget stop loss and capital management
When we reach the first target, save some profit and then change the stop to entry
Comment if you have any questions
Thank You

Polygon: Your Altcoin ChoicePolygon has been bearish since early December 2024, same with most of the Altcoins market. This bearish period is coming to an end and I can say this based on two simple signals. A bullish divergence with the RSI and a falling wedge pattern.
The falling wedge pattern on its own can be doubtful because it can always extend. In fact, any signal in isolation can produce more harm than good. That is why I always look at a combination of signals to support my bias.
There is also a small volume breakout yesterday. This is a weak signal but when combined with the RSI bullish divergence and marketwide action, what the rest of the market is doing, it becomes a strong early signal.
➖ MATICUSD Daily RSI Bullish Divergence
Polygon's daily RSI hit bottom in early November 2024. Ever since, it has been producing higher lows. This makes it a very strong bullish divergence. MATICUSD has been moving lower and producing strong lower lows. This is the reversal signal. Polygon will soon grow.
Thanks a lot for your Altcoin Choice.
Namaste.

(MATIC) POLYGON "past ticker"Polygon was originally listed to Coinbase on 3/11/2021. Now what was MATIC goes by POL. POL was listed during September of 2024. For whatever reason it seems like Polygon (POL) has not seen as much attention as with when Polygon was (MATIC). Also, Solana (SOL) has been the main avenue of attention for the last couple of years outside of the mass appeal for NFTs on Ethereum's blockchain and Bitcoin payment system, savings adjusted reality.

MATICUSD - Still WaitingMATIC is a popular altcoin that I believe is undervalued
I have a target of $10 for myself
I think the run will be a very fast run up similar to the first run up
My thoughts are plotted with the bars pattern tool in green
The run will occur during an alt season that is yet to come
The horizontal support is the dotted line
What are your thoughts on MATIC?

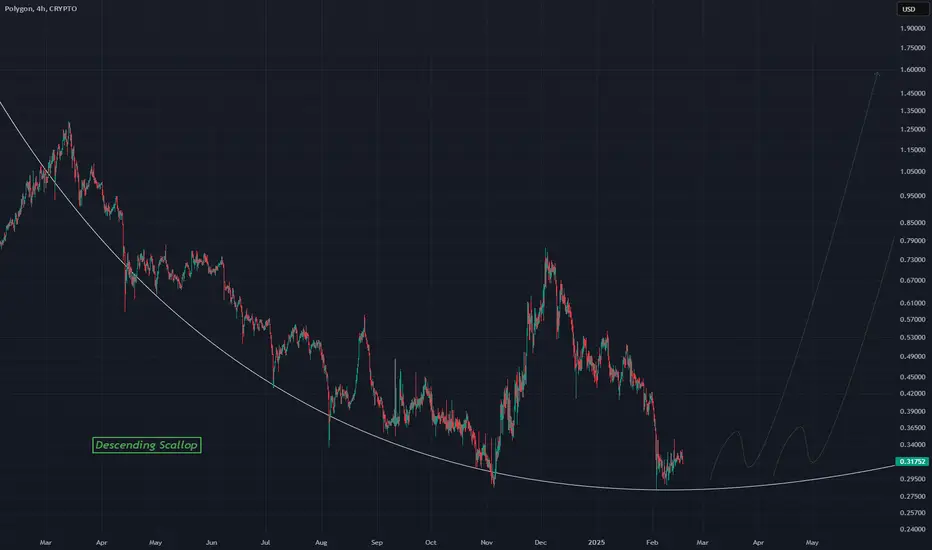
MATICUSD - Descending Scallop Reversal PatternA reversal pattern on this 4Hr chart for MATIC
MATIC has been beaten down hard and is due for a reversal and this pattern suggests it
Price slowly will flip towards the bulls favor and they will take control
The scallop pattern can be identified by a curve like this, this one being a descending one
Again the 4Hr chart
Hitting a bottom on MATIC?...I don't really trade Crypto's however this one stood out to me as a potential opportunity on the weekly time scale.
MATIC has been trending down since late 2021 but it has always shown a bounce around the $0.30 zone, ultimately creating a very large descending triangle coupled with a MACD that has been diverging up.
Could we see a rally ahead towards $1.00+? well that remains to be seen but I liked the setup and took the opportunity. Should be interesting in how this develops and thus, I'll be keeping an eye on this one.
I'm also checking out DOGE and XRP.
As always, Good Luck & Trade Safe.

MATIC returning to equilibrium would be a 128% gain from here!MATIC is looking extremely undervalued at current levels. The price has pulled back considerably since the "Trump election pump" and is forming a nice wedge on the 4-hour chart, which is currently on a four-count. A price move back to equilibrium from the wedge's bottom trendline would, by itself, result in approximately a 128% gain.
Longer term, if the price breaks out of the monthly chart wedge pattern (see comments below for the chart), which is also currently trading at a four-count, we could see some incredible price appreciation over the next 6 to 9 months.
Good luck, and always use a stop-loss!

MATICUSD Big Breakout Price within this triangle will lead to a large breakout
A triple bottom is the main cause for this bull situation
BULLISH LONG TERM
Matic$

Polygon at Key Support Zone - Will It Bounce to 0.4700?COINBASE:MATICUSD has reached a significant support level that has previously attracted buying interest, often resulting in bullish recoveries. This level aligns with previous market reactions, highlighting its role as a key area to watch.
If the support holds and bullish confirmation emerges—such as bullish engulfing candles or long lower wicks—a move toward the 0.4700 level is anticipated. However, if the support is broken, the bullish outlook could be invalidated, opening the door for further bearish momentum.
Traders should closely monitor this zone for signs of buyer strength before considering long positions. As always, risk management is essential to mitigate potential losses.

POL - Bullish Pressure Soon!Hello TradingView Family / Fellow Traders. This is Richard, also known as theSignalyst.
📈POL has been overall bearish trading within the falling channel marked in blue.
Currently, it is approaching the lower bound of the channel.
Moreover, the purple zone is a strong structure and demand.
🏹 Thus, the highlighted blue circle is a strong area to look for buy setups as it is the intersection of support and lower trendline acting as a non-horizontal support.
📚 As per my trading style:
As #POL approaches the blue circle, I will be looking for bullish reversal setups (like a double bottom pattern, trendline break , and so on...)
In parallel, for the bulls to take over long-term, a break above the upper blue trendline is needed.
📚 Always follow your trading plan regarding entry, risk management, and trade management.
Good luck!
All Strategies Are Good; If Managed Properly!
~Rich

POLYGON updatePOL full send to a new ATH!
Breaking 0.285 is the stop-loss.
Passing $0.755 is the bullish confirmation.
#Polygon

#MATIC/USDT Ready to go higher#MATIC
The price is moving in a descending channel on the 4-hour frame and sticking to it well
We have a bounce from the lower limit of the descending channel, this support is at a price of .4471
We have a downtrend on the RSI indicator that is about to be broken, which supports the rise
We have a trend to stabilize above the moving average 100
Entry price 0.5090
First target 0.5432
Second target 0.5815
Third target 0.6200

MATICUSD - Large Double BottomPrice is reaching this area that has previously been seen as support
Suggesting another bottom here, creating a double bottom
This will lead price to new highs
Price is waiting to pop off

TradeCityPro | MATIC(POL) Fresh Look at MATIC During Christmas👋 Welcome to TradeCityPro Channel!
Let’s analyze POL, formerly known as MATIC, due to your frequent requests. 😊
🌐 Overview Bitcoin
Before starting, let’s take a look at Bitcoin. In the 1-hour timeframe, it is currently fluctuating below the 98807 resistance. This resistance has been tested multiple times, indicating a high probability of breaking through.
It seems likely that Bitcoin dominance will increase along with this potential upward movement. Therefore, it might be better to either
Open a position on Bitcoin itself, Look for altcoins that show a bullish trend against Bitcoin and take triggers to open positions, Just make sure to watch out for Bitcoin’s low volume.
📅 Weekly Timeframe
MATIC, which once ranked well in the market, is now underperforming. The repeated blockchain hacks have caused significant damage to its ecosystem, leading to the rebranding from MATIC to POL.
MATIC could have remained among the top 10 coins, but poor project management caused DeFi activities and TVL to shift to platforms like Solana, SUI, and Base.
Personally, I wouldn’t consider buying MATIC unless its DeFi ecosystem becomes active again. For those interested in purchasing, buying above 0.7629 could be an option, but only if the volume increases for both the coin and its chain.
If you have been holding MATIC for some time, I suggest selling below 0.3636 in the weekly timeframe. On lower timeframes, I can suggest other exit points. Alternatively, you can use DeFi platforms to create USDT liquidity using borrow & lend mechanisms.
Note that MATIC faked the 0.3636 support and rebounded with a bullish engulfing candle, creating a new upward move. Personally, I might become interested in this coin after 1.2457.
🌞 Daily Timeframe
After bouncing from 0.2922, MATIC had a solid upward movement. However, most coins experienced similar trends, so it cannot be said that MATIC outperformed.
If the price doesn’t drop below 0.4738, it can be considered a sign of gradual recovery. This level is significant both from a Dow Theory and Fibonacci perspective. If 0.5794 resistance isn’t broken and the price gets rejected, there is a high probability of losing the 0.4738 support.
I recommend selling your holdings if the 0.4738 level breaks and you have purchased at higher levels. However, if your entry was at 0.3623 or lower, you can continue holding and exit risk-free.
⏰ 4-Hour Timeframe
MATIC is currently stuck below the 0.5316 resistance and fluctuates within the range of 0.4654 to 0.5316.
📈 Long Position Trigger
I would personally avoid this coin due to its low volume. However, after breaking 0.5316, you can open a risky long position if you’re comfortable with the risk. I’d still prefer to long Bitcoin instead.
📉 Short Position Trigger
given the weak condition of this coin, you can consider opening a short position below 0.4654. Keep in mind that your short trades should have quick profit-taking and small stop-losses to exit the market efficiently.
📝 Final Thoughts
Stay calm, trade wisely, and let's capture the market's best opportunities!
This analysis reflects our opinions and is not financial advice.
Share your thoughts in the comments, and don’t forget to share this analysis with your friends! ❤️
