MATICUSDT.1DBased on the provided market data, the cryptocurrency MATIC is currently trading at $0.79 against USDT. The Relative Strength Index (RSI) for 4 hours, 1 day and 7 days are 56.35, 49.23, and 52.23 respectively. These figures indicate that the coin is neither in an overbought nor oversold condition, suggesting a balanced market sentiment.
The Moving Average Convergence Divergence (MACD) for 4 hours, 1 day, and 7 days are 0.0012, -0.012, and 0.023 respectively. A positive MACD indicates that the crypto is on an upward trend, while a negative one suggests a downward trend. Here, the MACD data suggests a mixed trend.
The Bollinger Bands (Bb) for 4 hours, 1 day, and 7 days are 0.80, 0.83, and 1.00 respectively. The current price is below the upper band for all periods, indicating a potential for price growth.
In terms of support and resistance levels, the first, second and third support levels for 4 hours are 0.77, 0.72, and 0.68 respectively. For 1 day, they are 0.74, 0.68, and 0.60. For 7 days, they are 0.68, 0.60, and 0.49. The resistance levels for 4 hours are 0.83, 0.87, and 0.94. For 1 day, they are 0.94, 0.98, and 1.074. For 7 days, they are 0.96, 1.10, and 1.22.
Overall, MATIC is showing mixed signals with a balanced market sentiment. The positive 4h MACD and the placement of the current price below the Bollinger Bands' upper limit suggest potential for price growth, but the negative 1d MACD indicates a possible downward trend. Therefore, investors should closely monitor market trends and indicators, and consider their risk tolerance and investment objectives before making investment decisions.
Matic

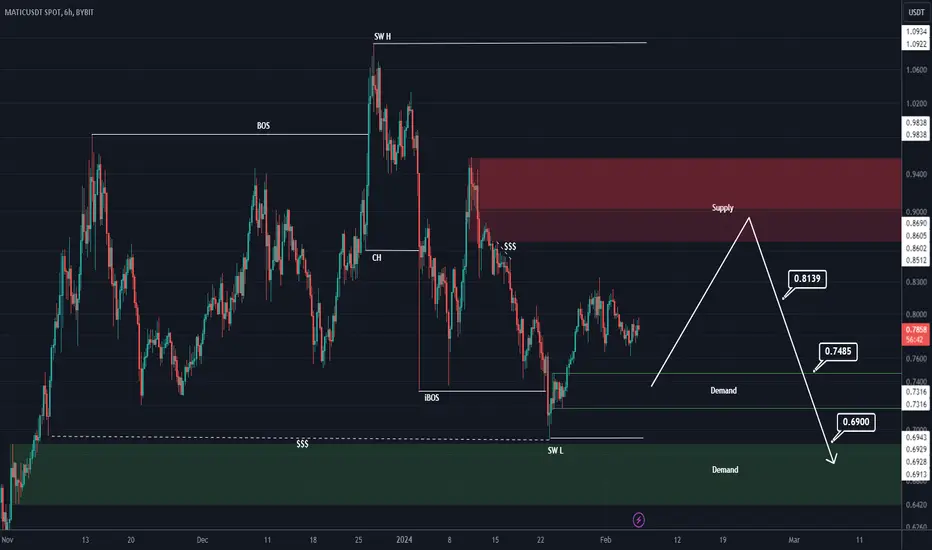
Matic analysis (4H)We have an important supply on the MATIC chart that may cause a drop or change the trend.
We have the change of structure with bearish CH on the chart and we also have supplies that have been mitigated and have moved sell orders to lower ranges with lower H and L.
In case of rejection from Supply, we have specified the targets and
For risk management, please don't forget stop loss and capital management
Comment if you have any questions
Thank You
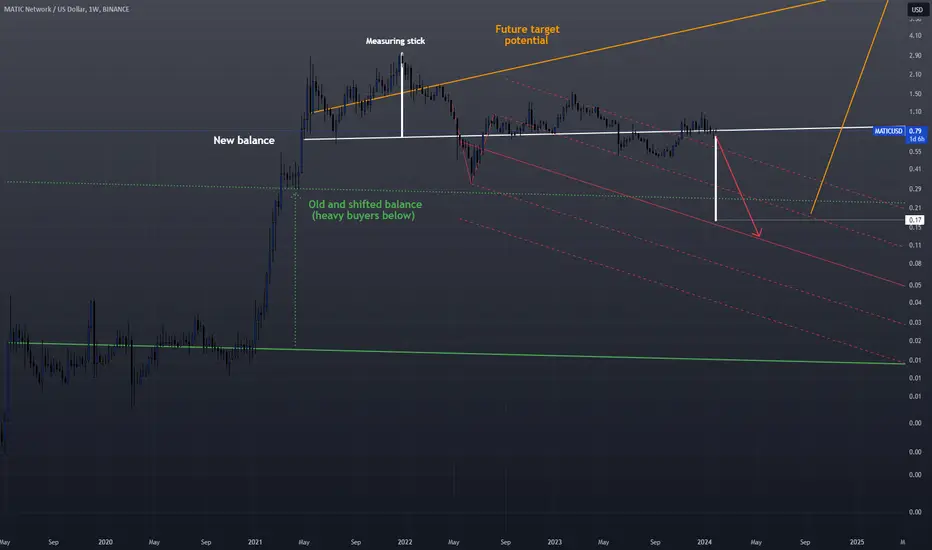
MATIC may contract by 80% before next bullish rallyMATIC may still be overpriced and needs a bigger correction before the heavy buyers step in. In my attempt to gauge the size of that correction I have concluded that the price may drop to around 0.17 USD. Please note that this is weekly, logarithmic chart.
MATIC/USDT Could MATIC back to break resist or back to demand ?💎 MATIC has recently experienced significant developments in the market. Currently, MATIC has displayed strength by bouncing from the demand area, which previously acted as a supply zone. Moreover, it has successfully broken out of a descending channel pattern.
💎 If this breakout is valid, there is potential for MATIC to continue its upward trajectory and attempt to break through the resistance area. Breaking this resistance is essential because a successful breakout, probability could pave the way for MATIC to reach our target at the Bearish OB area.
💎 However, if MATIC fails to sustain its upward momentum and experiences a false breakout, there is the possibility that the price will retreat to the demand area to establish a new bullish momentum.
💎 The demand area holds significant importance, as a breakdown from this level could signal a return to bearish sentiment, potentially driving the price back towards the strong support area.

MATIC-USDT / 1H / TECHNICAL ANALYSIS BINANCE:MATICUSDT Resistance at 0.8080, support at 0.7389. My target for wave analysis is 0.7983.
Like and comment if you find value in our analysis.
Feel free to post your ideas and questions at the comments section.
Good luck

0.90 to 1.10 MATICAnalyzing the current market trends and technical indicators, my projection for #MATIC in the upcoming 2024 bull market is a price range between $0.90 and $1.10 USD.
This valuation is based on several key factors, including historical data, recent market performance, and the overall growth trajectory of the cryptocurrency sector. #MATIC's fundamentals, coupled with increasing adoption and technological advancements, suggest a strong potential for this price range to be achieved.
As always, it's crucial to monitor market dynamics closely, as cryptocurrencies can be volatile and subject to various external influences. This forecast considers both the potential market highs and the resilience of #MATIC in sustaining its value in a fluctuating market.

Matic/UsdtCRYPTOCAP:MATIC is displaying positive signs, and the chart includes marked levels for reference.
NASDAQ:ALT LSE:JUP $TRIAS NYSE:SUI SEED_ALEXDRAYM_SHORTINTEREST1:CHNG #CryptoCommunity

MATICUSDT - Symmetrical TrianglesTwo symmetrical triangles the first leading to a large breakout of around 16000%. Will we see anything comparable in the future

Matic with Head & Shoulder patern In the 4h chart it rebounded after broke down the neckline of the H&S pattern
But it broke down the triangle in the 4h and we can set the SL at (0.7379) to get better R/R
TP1: 0.6170
TP2: 0.5755
TP3: 0.5311
TP4: 0.4867
TP5: 0.3428

MATICUSDTI propose to consider the medium-term situation, because in the short term everything looks bad. A symmetrical triangle figure appeared on the chart. The price can go both up and down with a 50/50 chance.
In case of an upward movement and consolidation, it is worth considering the targets indicated by blue lines.
Target 1 - 1.1517
Target 2 - 1.3871
Target 3 - 1.5898
In case of going down and consolidating below, focus on the red lines as support in the area of 0.4007 - 0.2334
Also you can ask for only 1 altcoins analysis and i will try to do my best to cover as much as i can✍️

Matic : A Lucrative Buying Opportunity For the Next Bull Run ?Based on my technical analysis, I'm convinced that MATIC has entered a prime accumulation zone, presenting a potentially lucrative buying opportunity in the range of $0.71 to $0.61. While I readily acknowledge that you will never know when the downside will be over, I firmly believe that the current price represents an attractive entry point for anyone interested in accumulating MATIC. This consolidation phase, as evidenced by the price action, could very well precede a significant upward move, making it a potentially opportune time to acquire a valuable position in this promising cryptocurrency.
Please note that this is a very longterm trade, If you want to accumulate buy only spot.

TLOS vs other alts performanceFor those having doubts about TLOS's performance since the bull run started at the end of October 2023, TLOS is on par with or significantly outperforming some of the major alts


Polygon (Matic): Coin, Target and Buy Zone Review!Hi all!
♾ Polygon was previously called Matic Network. Polygon (MATIC) is an Ethereum token that powers the Polygon network, which is used to scale Ethereum. Polygon's goal is to enable faster and cheaper transactions on Ethereum using Layer 2 sidechains, i.e. blockchains that run parallel to the main Ethereum blockchain.
✅Official website polygon.technology
Now let's move on to the charts on the main timeframes
M
➩ Globally, the price is in a downward movement as the monthly structure was broken and confirmed in 2022
➩ Now there is a corrective movement towards a wave of decline, which has lasted for almost two years.
➩ Below there is an unfilled IMB M ($0.0483 - $0.1829) and equal minimums on the way to it.
➩ Currently the price is testing IMB M ($0.6651 - $0.7505)
W
➩ On the weekly time frame, after reacting to OB W and filling IMB W, the price began to correct to the growth wave.
➩ Below in the form of support IMB W ($0.6651 - 0.6892 $) and the zone of combined OB W + IMB W ($0.5006 - 0.5994 $)
D
➩ On the daily timeframe, the price is still in an ascending structure, but, judging by the protracted correction, it will be broken.
➩ There is also an accumulation of a large pool of liquidity below, which can attract the price
💭On the chart I noted two options for reducing the price to potential areas for purchases
❗️Not a financial recommendation; before entering into any transaction, conduct your own analysis of the asset

MATICMATIC is currently trading in downtrend.
We can see it at the price of 1 or even at 1.5 dollar.
For that it needs to break the trendline & also the resistance level of 0.8870 dollar.

MATIC/USDT 4H analysis DUMP incomingMATIC is one of the most popular coins and is in consolidation phase, it will soon dump from 0.94 or dump after going towards 1.02. And might plummets up to 0.62 range

BITCOIN weekly roadmapGood time friends, I hope you are great.
According to last week's analysis, Bitcoin reached the range of $48,000 twice and could not go beyond this range.And from this area, it started its falling movement, this fall could be predicted both technically and the news that has come for Bitcoin during the last week.
Bitcoin is forming MTR in the daily time, it has broken the upward channel that we had downwards, the last bottom that I marked with a dashed line on the chart, below this range we also had a close candle.
In general, I see Bitcoin as bearish, this week I could not find a safe area for selling positions so that we can take swing selling positions.
But we can have buying positions in the range of (40000-41000) and (39400-39800) by getting appropriate approvals, if there is an opportunity for selling positions, I will inform you in the next analysis.

#MATIC #Polygon #Final #Update 'B' #Wychoff #Distribution #Eddy#MATIC #Polygon #Final #Update 'B' #Wychoff #Distribution #Eddy
We Are Here Guys <3 Enjoy ;-)
This is a new update of final (( MATIC/USDT )) update: check link :


3- entry (MATIC)📊Analysis by AhmadArz:
safe in chart risk by 3-entry.
🔗"Uncover new opportunities in the world of cryptocurrencies with AhmadArz.
💡Join us on TradingView and expand your investment knowledge with our five years of experience in financial markets."
🚀Please boost and💬 comment to share your thoughts with us!

MATIC MIGHTMATIC/USD and MATIC/BTC
- Both reaching into oversold levels on the RSI
- Both in parallel channels & near or at bottom
A long term accumulation window may be opening here
Its very important to review my TOTAL 2 and TOTAL 3 Altcoin charts which shoe that a secular bull run for alts is more probable between Dec 2023 and Mar 2024.
Regardless now is the time and over the next 6 months to be considering accumulation for LONG TERM trade.

MATICUSDT Buy stopWe observe the third head and shoulders pattern on the Matic H1 chart. If the price breaks the 0.8888 level, the pattern will be confirmed. Risk-reward ratio is 1:2

#MATIC #Polygon #Final #Update #Wychoff #Distribution #Eddy#MATIC #Polygon #Final #Update #Wychoff #Distribution #Eddy
(("All the relevant areas and explanations on the chart are clear and clear, the trading setups need to get confirmation to enter, if you don't know how to get a trigger and confirm entering into transactions, this analysis is not suitable for you, the above analysis is for professionals. and if you are a beginner, my suggestion is that you don't destroy your capital and first learn technical analysis and basic trading along with psychology and risk and capital management from reputable sources and courses, and then enter the financial markets."))
(("The above analysis and setups and points and areas are combined with most of the combined styles such as price action, supply and demand, RTM, ICT and also with the analysis of important indicators such as Dominance Tether and Bitcoin.
If you are familiar with the mentioned styles and know how to get approval to enter the above styles, use the above analysis.
This is not an investment proposal and only my opinion, please act based on your experience and decisions."))
~~~~~~~~~~~~~~~~~~~~~~~~~~~~~~~~~~~~~~~~~~
I also suggest you to view my #Analysis of the Phases of Richard #Wyckoff #Accumulation & #Distribution on #Bitcoin #Currency from the link below :
~~~~~~~~~~~~~~~~~~~~~~~~~~~~~~~~~~~~~~~~~~
Analyses of Trading Ranges By : Dr. #Eddy SunShine 👨🏻💻 1/14/2024 ❤️
