pol pol usdt daily analyses
time frame daily
risk rewards ratio > 5 ( incredibly )
look at the chart
this analyse is base on price action and support and resistance
pol has 2 resistance boxes above its price
the weak one ( red ) and the strong one (blue)
pol broke the weak resistance and price came down little and moved up and broke again.
now it pass the first box and will move to strong one.
if pol can break second resistance ( blue ) we will reach our valuable target and 500% benefit
it is not out of reach
Matic

MATIC looks tired
MATIC looks tired.
- Distinct Wave 5 could be ending
- Overbought Stoch RSI 8h
- Broken down from long-term ascending parallel channel
Decreased Network Activity:
Despite an increase in active addresses, MATIC's price has declined, indicating that heightened network activity isn't translating into price support.
Increased Selling Pressure:
A rise in open interest indicates that traders are increasing exposure to MATIC, but if this is driven by short positions, it could lead to increased selling pressure and a subsequent price decline.
A good strategy is repetitive, and even boring.
Keep it simple and efficient.

Polygon (POL) AKA "MATIC" - Long Key LevelsPolygon (POL) or "MATIC" has experienced a strong rally recently, climbing from its monthly low of $0.40 to its current price of $0.70. This implosive move has brought the bulls to push POL to a critical descending trendline resistance level that the bears have held in a long-term downtrend since 2022.
The key level to watch is the $0.76 mark, where the neckline and trend line meet with previous resistance zones. A breakout above $0.76 could potentially surge POL to it's 1st target which is around a resistance level of: $0.89. If momentum continues, then price action will retest between: $1.23 - $1.48 representing a potential upside of +100% from the breakout at this current point

you're not ready yet MATIC, chill in the triangle for now It reaches and hits exactly the major line going from its old peak of 2021. Unless it convincingly breaks out and flips this major line, the path of least resistance for MATIC is to continue accumulating for a few more weeks in the triangle before a path opens to a massive rally

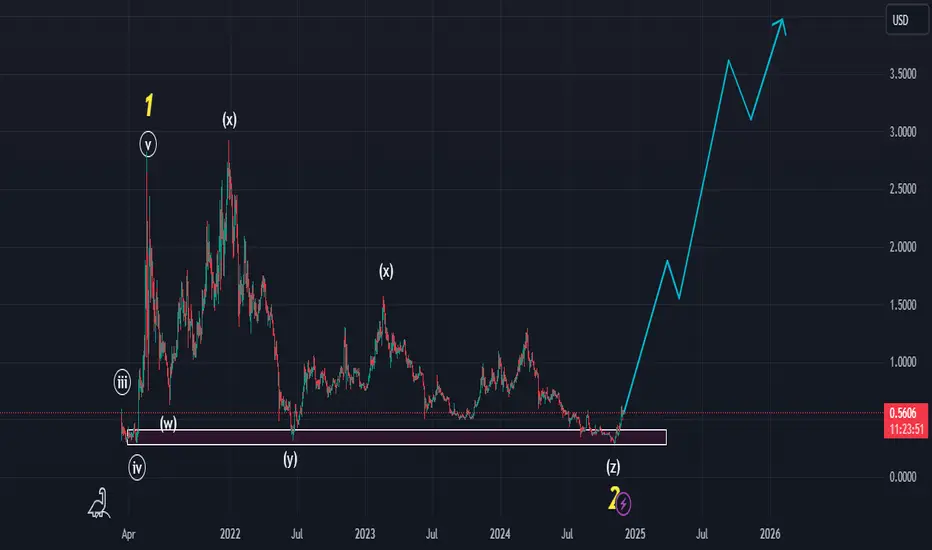
The Bullish Case of POLYGONPOL or MATIC made a deviation in the 1st of Nov this year which confirmed a major bottom to end the wave (4) which lasted for almost 3 years. Now the target is a new all time high!
Passing $1.29 confirms the bullish idea.
Breaking $0.32 is a stop-loss/ invalidation.

#MATIC/USDT#MATIC
The price has broken the descending channel on the 1-day frame upwards and is expected to continue
We have a trend to stabilize above the 100 moving average again
We have an upward trend on the RSI indicator that supports the rise by breaking it upwards
We have a support area at the lower limit of the channel at a price of 0.3400
Entry price 0.3900
First target 0.4917
Second target 0.5847
Third target 0.7193

Hypothetical inverse head&shoulders pattern will materialize…. . .-if- Polygon decides to correct here for even a few days we will officially start forming a right shoulder and then we get the benefit of having an even higher target than the current $1.06 target we are heading towards for the falling wedge breakout. There is also 2 double botto breakouts and a channel breakout on the horizon too just above those 2 targets so it should create a bunch of bullish momentum as all these overlapping bullish patterns start falling like a domino effect. Of course if Polygon instead chooses to continue pumping towards the $1.06target without correcting for a day or few then the inverse head and shoulders will not materialize. *not financial advice*

Hypothetical inverse head&shoulders pattern will materialize…-if- Polygon decides to correct here for even a few days we will officially start forming a right shoulder and then we get the benefit of having an even higher target than the current $1.06 target we are heading towards for the falling wedge breakout. There is also 2 double botto breakouts and a channel breakout on the horizon too just above those 2 targets so it should create a bunch of bullish momentum as all these overlapping bullish patterns start falling like a domino effect. Of course if Polygon instead chooses to continue pumping towards the $1.06target without correcting for a day or few then the inverse head and shoulders will not materialize. *not financial advice*

Polygon (POL ex-MATIC) gets increased accumulation: $1 soon?The Polygon token has reclaimed its position in the top 30 cryptocurrencies with a weekly price surge of ~50%. With this, this Ethereum-based Layer-2 altcoin is regaining momentum and preparing itself to achieve a multi-year high this bull run. We at CoinPedia have created an in-depth Polygon price analysis and possible short-term price targets.
After recording a new yearly low, the Polygon price has experienced a strong bullish reversal. This has resulted in this altcoin reclaiming an 8-month high. Moreover, the altcoin is on the verge of possibly breaching the resistance level of the channel pattern, highlighting increased bullish sentiment.
Moreover, with a surge of 143.36% during November, this altcoin has breached its resistance trendline of the descending channel pattern and has further formed an ascending channel pattern. Notably, this altcoin continues trading within it with a constant bullish price action.
The Moving Average Convergence Divergence (MACD) displays a constant green histogram in the 1D time frame. Moreover, with its averages recording a constant uptrend, the Polygon price may continue gaining momentum this week.
Maintaining the price above its support level of $0.690 could set the stage for this altcoin to prepare to retest its resistance level of $0.890. Furthermore, if the bullish momentum sustains at that point, this could result in it retesting its target price of $1.
Conversely, if the crypto market experiences an increase in liquidations, the POL coin price could retest its support level. Furthermore, if the bears dominate the crypto space, the MATIC price could retest its low of $0.50.

Polygon on its way to hitting a double bottom breakout targetPrice action steadily climbing up the measured move line to the target. Golden cross coming up within the next week or so. *not financial advice*

Polygon to $0.66 in short termPolygon is breaking the downtrend BINANCE:POLUSDT
Entry 0.4192
Target 0.66
Stop 0.2162

Trading opportunity for POLUSDTBased on technical factors there is a Buy position in :
📊 POLUSDT
🔵 Buy Now
🪫Stop loss 0.5620
🔋Target 1 0.7950
🔋Target 2 0.9900
🔋Target 3 1.2500
💸RISK : 1%
We hope it is profitable for you ❤️
Please support our activity with your likes👍 and comments📝

Alikze »» RAY | Failure of the supply areaIn the weekly time, after a complex correction in the limit of 0.13, after the bottoming, it left the density and broke the first supply zone with a kinetic wave, and completed the supply zone with a three-wave pullback correction, and now it can Continue another kinetic wave to the specified areas.
⚠️If the green box area is lost, the transaction can be reversed. Therefore, be sure to pay attention to this point.
»»»«««»»»«««»»»«««
Please support this idea with a LIKE and COMMENT if you find it useful and Click "Follow" on our profile if you'd like these trade ideas delivered straight to your email in the future.
Thanks for your continued support.
Sincerely.❤️
»»»«««»»»«««»»»«««

Trading opportunity for POLUSDT MaticBased on technical factors there is a Sell position in :
📊 POLUSDT
🔴 Sell Now
🪫Stop loss 0.6300
🔋Target 1 0.5500
🔋Target 2 0.5000
🔋Target 3 0.4200
💸RISK : 1%
We hope it is profitable for you ❤️
Please support our activity with your likes👍 and comments📝

Polygon (MATIC)Polygon needs no introduction; a versatile platform which offers various solutions. Recent news about collaboration between Google Cloud and Polygon shows where this project is headed. Technical-wise, Polygon is moving in a upward inverted wedge. Have to wait and see if price can break the all time high (the double top level). Let's see what happens.

maticmativ technical analysis basically on elliott waves principle
matic can be make a new high as a ATH on 5.70$
wait and watch
Will #MATICUSDT Bounce Back or Dive Further? Key Levels to WatchYello, Paradisers! Is #MATICUSDT gearing up for a breakout, or are we staring at another downward spiral? Let's take a look at the #Polygon's latest analysis:
💎Currently, #MATIC is holding steady within a key support range of $0.337-$0.355, a zone that has proven resilient against downward pressure in the past. This is a positive sign, but #Polygon needs to maintain momentum here to validate any hopes of a bullish continuation. Only then can we anticipate a potential breakout from the descending channel.
💎For #MATIC to truly signal strength, it must decisively break above the internal resistance at $0.439. This level is the gateway to bullish momentum. A clear breakout would likely be accompanied by strong, engulfing candles and sustained volume—hallmarks of genuine market conviction.
💎The risk of losing steam is real. Should #Polygon fail to break through $0.439, sellers could seize the upper hand. In this case, the $0.337-$0.355 support zone becomes even more crucial. If this support holds, we might see renewed buying interest and a potential rebound.
💎However, a break below $0.337 would likely send #MATIC tumbling toward the $0.287 demand level. Should it also lose this level, we could be facing a deeper downtrend—marking a pivotal moment for #MATICUSDT’s trajectory.
Don’t let FOMO get the best of you; wait for clear confirmations before making your move.
MyCryptoParadise
iFeel the success🌴

POL 1$ TargetLike I said earlier, any rebranding is a green flag for investors and an indicator to buy the asset. POL was no exception. 1$ is exactly the target that big investors are waiting for. I think it's no secret that along with Bitcoin, Ethereum and Solana, a major market maker was accumulating POLYGON, which eventually became POL. Bullish!
Horban brothers.

MATICUSD showing strengthHello,
Today we look at MATIC.
- MATIC is still in strong support zone, not yet broken out.
- It is also battling 21 weekly EMA. If it manages to cross up, it is a very bullish sign.
- It is in a bullish divergence (RSI making higher low while price makes a lower low).
- Volume has increased in the last weeks, showing potential that bottom is in.
- RSI got up above 43 and tested it as support. RSI cross above 43 has always showed to be bullish.
Resistance levels:
- 0,75 USD
- 1 USD
- 1,3 USD
Remember to take profits along the way. Do not be too greedy. Success is a series of small(er) wins, not one major win.
Make sure to check my other posts, all are still valid.
XLM has already made x2 since my post, DOT is up 50%...
Not a financial advise. Do your own research.
Good luck!

POLY-MATIC Swing Long Idea - Altcoin SeasonMATIC/POLY is one of the leading Ethereum Layer 2 chains. We haven’t seen an ETH rally yet, so ETH-based coins (ETH betas) are currently underperforming. However, I recommend considering a small position to potentially catch an ETH pump, as these ETH-based coins have significant technical potential.
Technical Analysis:
The price ran the 2022 low and the 2021 March low, generating strong bullish momentum. The run on the 2021 March low is particularly significant because that low initiated the 2021 bull cycle for this coin. I believe this level represents the maximum pain point for MATIC, and most paper hands have likely exited after this level was swept.
Following this move, we observed strong bullish momentum, and a few days later, the weekly structure shifted to bullish, creating a weekly demand zone, which I have marked on the chart. Recently, the bearish trendline responsible for the downward trend since Spring 2024 was broken, and we also have a daily demand zone just below the trendline.
I believe the price may retrace to the daily and weekly demand zones, possibly retesting or deviating slightly from the trendline before taking off. This area also aligns with the Fibonacci equilibrium (discount) zone, which adds further confluence for a reaction from there.
I will look for LTF confirmations before initiating the setup.
SL: $0.27 (daily close below)
TP1: $0.78 (2x from the entry)
I plan to carry this position until the end of the 2025 altcoin bull cycle and will not take profits from this trade. However, I strongly recommend taking some profits while the price rises. My risk management strategy is unique and may differ from yours.

MATIC (Polygon) Down Channel BreakBreak of the down channel on this 4hr timeframe with an added support of the 200MA in white.
I think this could be the start of a reversal for MATIC as the market is beginning to heat up.
Very cheap still right now.
Bullish on 4Hr and Daily, Weekly so on, timeframes.

Alikze »» ADA | The scenario of wave 3 or C rising super cyclesAccording to the analysis of the previous post that was presented in the 8h time, according to the cup pattern, it made a growth as high as the height of the pattern valley, after which it encountered supply.
💎 But in the weekly time, due to the fact that it created a reliable floor in the golden zone of the previous wave, it faced demand.
💎 Currently, this return wave can be a pullback to a broken structure and a swing, which should meet good demand in the 39 cents area.
💎 First scenario: Therefore, according to the structure and movement behavior, it can have the first target of 0.8789 to 0.9766 by maintaining the green box area.
💎 Alternative scenario: if the range of 39 cents is broken, it can retest the floor of the range of 23 cents again.
»»»«««»»»«««»»»«««
Please support this idea with a LIKE and COMMENT if you find it useful and Click "Follow" on our profile if you'd like these trade ideas delivered straight to your email in the future.
Thanks for your continued support.
Sincerely.❤️
»»»«««»»»«««»»»«««

Trading opportunity for POLUSDTBased on technical factors there is a Buy position in :
📊 POLUSDT
🔵 Buy Now
🪫Stop loss 0.3600
🔋Target 1 0.5000
🔋Target 2 0.6500
🔋Target 3 0.9500
💸RISK : 1%
We hope it is profitable for you ❤️
Please support our activity with your likes👍 and comments📝
