MATIC Polygon and the Altcoin Season ThesisIf you haven`t sold MATIC here:
Then the recent developments in the cryptocurrency market, particularly the favorable court ruling for Ripple Labs, signal an optimistic start to a new altcoin season.
With the federal judge ruling that some of Ripple's sales of the XRP token do not fully meet the definition of a securities offering, it instills confidence in the altcoin space.
This ruling brings clarity to the regulatory landscape and alleviates concerns surrounding XRP, leading to major cryptocurrency exchanges, including Coinbase, relisting the token. The reintroduction of XRP to these platforms demonstrates growing acceptance and renewed interest in this altcoin.
The anticipation surrounding the approval of a spot bitcoin ETF in the United States adds to the positive sentiment in the market.
The successful launch of a previously approved ETF in Europe further reinforces the upward trend for altcoins.
The recent court ruling that declared XRP as not a security sets a precedent that could potentially benefit other cryptocurrencies currently classified as securities by the SEC. In the SEC's case against Binance, they designated 10 cryptocurrencies, including BNB, BUSD, SOL, ADA, MATIC, ATOM, SAND, MANA, AXS, and COTI, as securities.
Additionally, in the SEC's lawsuit against Coinbase, they named 13 cryptocurrencies, reinforcing their stance on SOL, ADA, MATIC, SAND, and AXS, and adding CHZ, FLOW, ICP, NEAR, VGX, and NEXO to the list.
This development showcases the increasing institutional acceptance of cryptocurrencies and creates a ripple effect across the market, providing a boost for various altcoins, including MATIC Polygon, for which my price target is $0.95.
Looking forward to read your opinion about it!
Matic

Let's surf before the stormMATIC currency can have a growth of up to 8%, but for the second target, it is very important how it will deal with its resistance range at the same 8%. which can't be supported by the blue color, there is a possibility of a fall of 6 and then the formation of a corner pattern

MATIC, XRP ☁️;BTC, BNB, ADA ☀️?The sun keeps shining ☀️ on the global cryptosphere, promising a slightly bullish market with upside potential in the next 24 hours. However, Ripple’s XRP and Polygon’s Matic encounter some clouds ☁️, signaling a potential downside trend.
Looking ahead over the next week, the forecast is mixed with cloudy weather ☁️ for altcoins like Ether, Litecoin, XRP, and Matic. On the other hand, Bitcoin, Binance, and Cardano enjoy sunnier trading conditions ☀️, suggesting a continued upside potential.
Follow us for more crypto weather insights!

🔥 MATIC Potential Bear Flag Forming: 2 In 1 Signal!After weeks of selling, MATIC seems to have found support and has been trading inside a bullish channel for over a month now. A bullish channel after a strong sell-off often results in a bear flag pattern, which is a continuation of the bearish trend.
Looking at this chart, we can construct two different signals.
The safest trade would be to wait for the price to fall through the channel's support and enter once the price has closed below it. A more risky trade would be to enter from the to resistance, around the current area. Bot trades have the same target: the current bear market bottom around 0.32. The potential win of the risky trade is much higher because of the tighter stop and the further profit target.

Poised to Surpass Ethereum's Market Cap by 2025Matic Polygon, a rising star in the world of blockchain technology, is set to make waves in the coming years. With its innovative approach to scaling and a growing ecosystem of decentralized applications (dApps), Matic Polygon is positioned to outshine Ethereum and surpass its market capitalization by 2025.
The Potential of Matic Polygon:
Matic Polygon, built on the Ethereum network, addresses one of the key challenges faced by Ethereum: scalability. By implementing a Layer 2 scaling solution, Matic Polygon significantly improves transaction speeds and reduces fees, making it an attractive choice for developers and users alike. This scalability advantage positions Matic Polygon as a formidable contender in the blockchain space.
Expanding Ecosystem and dApps:
Matic Polygon's success is further bolstered by its thriving ecosystem. Developers are increasingly adopting Matic Polygon due to its seamless integration with Ethereum, enabling them to leverage the benefits of both platforms. As a result, an ever-growing number of innovative dApps are being built on Matic Polygon, attracting users from various industries and driving up demand for MATIC tokens.
Market Capitalization Potential:
The soaring popularity of Matic Polygon, coupled with its scalability advantages, is expected to propel its market capitalization to new heights. Ethereum's market dominance has long been undisputed, but the emergence of Matic Polygon presents a formidable challenge. Industry experts predict that by 2025, Matic Polygon will eclipse Ethereum's market cap, driven by its strong ecosystem, growing adoption, and efficient scaling solution.
Investment Opportunities:
Investors seeking promising blockchain projects with high growth potential are turning their attention to Matic Polygon. With its rapidly expanding user base, strong developer community, and supportive infrastructure, Matic Polygon offers a compelling investment opportunity. Its projected ascent in market capitalization presents a chance for early investors to reap significant rewards.
Conclusion:
Matic Polygon's innovative approach to scalability, expanding ecosystem, and projected market cap growth make it a force to be reckoned with in the blockchain industry. By leveraging its Layer 2 scaling solution and capturing the interest of developers and users worldwide, Matic Polygon is on track to surpass Ethereum's market capitalization by 2025. As the cryptocurrency market evolves, Matic Polygon presents an enticing investment opportunity for those looking to ride the wave of its success.

MATICUSDT 1HMATICUSDT 1H
What's New From Polygon: The recent restructuring of the Polygon Labs team, which promoted their company General Counsel, Marc Boiron, to the role of Chief Executive Officer. of value” of the Internet. The first major milestone in this effort involves implementing “decentralized governance” by July 17th.
Main support levels : 0.7343 / 0.7279
Main Resistance Levels : 0.7438 / 0.7497
RSI: Exhaustion of Selling Forces
MACD: seller
CHOP: 67.9

Matic Testing crucial Resistance Seems Like Getting ready for breakout formed & breaking Descending Channel In h8tf Incase Of breakout expecting 80 to 90% Bullish Wave

maticProbably, such a movement can be imagined for him. There is a possibility of an upward corrective movement and the implementation of such a movement

Fractal autoMATICaA.I running this chart must love fractally aesthetic B waves, just look at those B wave bits ...yummy ...
milk will flow like honey below .40
nfa
y axis only
dyor

MATIC - Don’t Buy the Breakout, Buy the RetestTLDR:
• MATIC is close to breaking out of the Range High.
• To trade long I need to see the following:
o Break out of the range.
o Move up to deplete the supply zone.
o Range high flipped to support.
• Only after these two conditions are met will it be a high-confidence long trade.
Background:
• MATIC is in a similar situation to many other altcoins. The MATIC situation is as follows:
1. Sharp drop.
2. Selling Climax.
3. Automatic Rally.
4. consolidation in a Range.
• Assuming that the correction is over, this could be an amazing opportunity to buy low and sell high. However, there’s a worm inside the apple that we need to avoid.
• MATIC has a supply zone just above the range high. Meaning that a break above the range high will, most likely, fail at the first attempt. Here are a few examples:
• DYDX Weekly TF:
• XRP Daily TF:
• BNB Daily TF:
So, what do we do?
• Simple, Patience. Don’t buy the breakout, buy the retest. If you miss out, there are other trades. Nonetheless, it is most probable that all you will miss is the stress and heartache of being in the red.
Trading Plan:
• This is a generic trading plan. It is applicable not just to MATIC but to any other asset that is consolidating in a range. I intend to use this tactic for ADA, FTM and BNB as well as MATIC.
1. Break above the range High
2. wait for the supply zone depletion
3. Wait for range high retest as support.
4. Wait for green dots on the TTM Squeeze indicator.
5. Go long.
Trade Idea:
• Entry: 0.715
• SL: Below last Low before the breakout app. 0.65
• Target: 1.568
• R: R: 1:12
• TP: 0.95, 1.18, 1.568
NFA
What do you think? Please share in the comments.
Best wishes.

A rise above 0.7778 is expected for a change in trendHello?
Traders, welcome.
If you "Follow", you can always get new information quickly.
Please also click "Boost".
Have a good day.
-------------------------------------
(MATICUSDT chart)
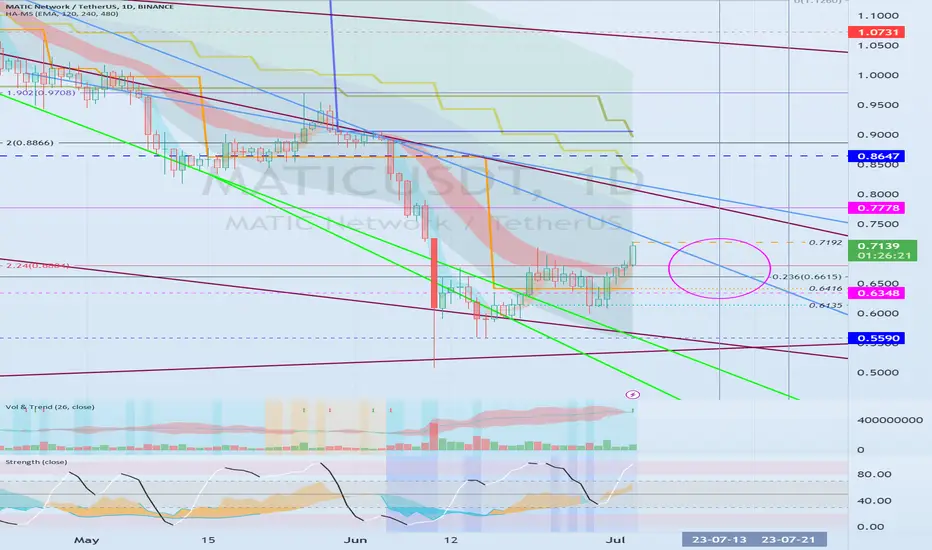
The HA-Low indicator on the 1W chart is about to form at the 0.7192 point.
Accordingly, when the HA-Low indicator on the 1W chart is created at the 0.7192 point, the key is whether it can be supported and rise around 0.7192.
However, since the 1M chart's HA-Low indicator was not created, you need to check whether the 1M chart's HA-Low indicator is created or supported around 0.7778.
If it doesn't, it's because it's likely to stay on the downtrend.
Therefore, it is necessary to check whether it is supported and rises in the 0.7192-0.7778 section.
If not, you should check if you can get support in the 0.6348-0.7192 interval.
As it maintains an uptrend while breaking through the HA-Low indicator on the 1D chart upwards.
1st: 0.7778
2nd: 0.08647-0.9059
Split selling is possible when resistance is received near the 1st and 2nd above.
The next period of volatility is around July 13th.
The CCI indicator is entering the oversold zone.
Therefore, when exiting an oversold zone, you need to check which point or zone is supported or resisted.
-------------------------------------------------- -------------------------------------------
** All descriptions are for reference only and do not guarantee profit or loss in investment.
** Even if you know other people's know-how, it takes a considerable period of time to make it your own.
** This is a chart created with my know-how.
---------------------------------
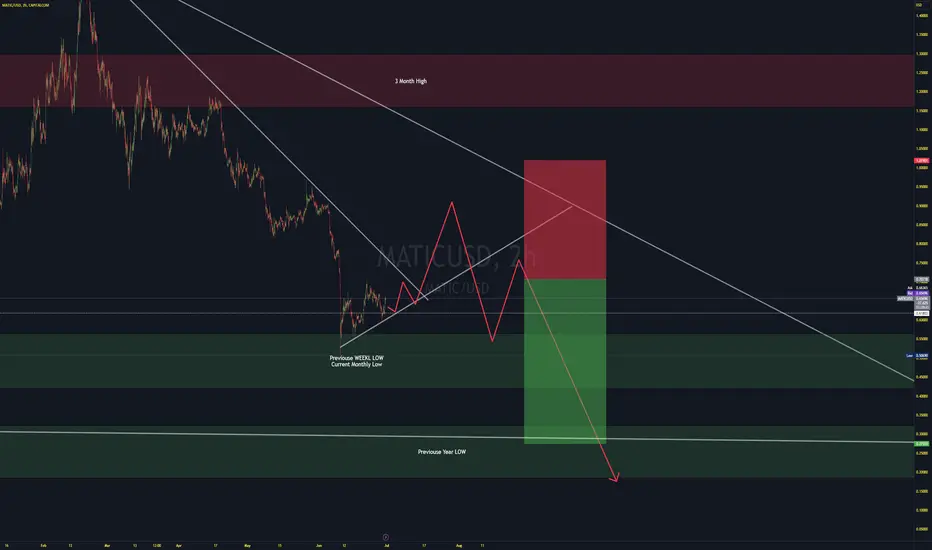
MATIC - KeyLevels for next weekIf you wanna take a trade on MATIC, maybe before that, you need to conisder this KeyLevels of support and resistance areas.
Careful with longs until on daily is still bearish / downtrend

Matic shortPolygon 2.0 architecture revealed, introduces unified liquidity & unlimited scalability
Formerly Matic Network, Polygon has seen attention lately, considering Securities and Exchange Commission clampdowns and platform delisting. Alongside other top alts, the SEC named MATIC as security in ongoing crypto regulation wave.
Polygon MATIC potential rally with the Stock MarketCryptocurrencies were left behind by the recent Stock Market rally.
With the arrival of new BTC Bitcoin ETFs, I expect the Crypto Market to follow!
MATIC/USDT long:
Entry Range: $0.60 - 0.65
Take Profit 1: $0.70
Take Profit 2: $0.82
Take Profit 3: $0.93
Stop Loss: $0.51


MATIC SHALL WE?Well looks like Matic is about to break the trend line very well
wait for the good break on the 1hr chart or 2hr chart, a retracement on 1hr or 30min chart and then we can long
Sl - 0.647
Tp 1 - 0.7
Tp 2 -0.78
tp 3 - 0.89

long MATICCRYPTOCAP:MATIC broke through the descending hendline. Bullish movement to resistance level at $0.71 is expected to happen.

Is MATIC Ready for 60% Downside Move As per ChartTechnical Chart Analysis of MATIC/BTC - Bear and Bull Market Insights
Market Overview:
MATIC is currently trading at 0.00002163 BTC, representing a significant decline of 65% from its all-time high. While the technical analysis suggests a bullish scenario due to the formation of a bull flag on the MATIC/BTC weekly chart, market sentiment does not support an upward move for MATIC at present.
Key Analysis Points:
Bull Flag Formation: The MATIC/BTC weekly chart indicates the formation of a bull flag pattern, which traditionally signals a potential bullish trend.
Market Sentiment: Despite the bullish chart pattern, current market sentiment does not align with an upward movement for MATIC.
Support Levels: The immediate support level for the bull flag pattern is at 0.00002100 BTC. A price drop below this level would confirm strong bearishness.
Target After Breakout: If hold Current Support then, the target for MATIC/BTC is projected to be 0.00000600 BTC, which represents a substantial decline of 60-70% from the current level.
Worst-Case Scenario: In the event that MATIC/BTC holds the current support level at 0.00002100 BTC, there could be a bounce towards 0.000036 BTC or even 0.000057 BTC before the anticipated downward movement.
Key Levels:
Support Levels: Significant support levels to monitor are at 0.000021 BTC and 0.000006 BTC.
Resistance Levels: Key resistance levels to watch are at 0.000036 BTC and 0.000060 BTC.
Disclaimer:
This analysis is not financial advice. It represents the personal opinion and analysis of the author. Individuals considering investments in any coins, including MATIC, should perform their own research and consult with financial professionals.
Follow us for More Chart Analysis.


MATIC 1D Interval ReviewThe last one in today's chart is the MATIC chart in pair to USDT, on a one-day interval. First, we will use the blue lines to mark the downtrend channel where the price is moving in the upper range.
Moving on, we can move on to marking support areas when the price returns to a correction. And here the first very strong support that has kept the price so far is at $ 0.58, but if we fall lower, the next support is at $ 0.31.
Looking the other way, we see that the price has to face the $0.76 resistance, only when it breaks it will move towards the $0.91 resistance and then towards the very strong $1.04 to $1,16 resistance zone.
Please look at the CHOP index, which indicates that we have more and more energy, the MACD indicates a downtrend, while the RSI shows that a small price increase gives a strong movement on the indicator, which can quickly limit the room for further increases, in the coming hours we can see further growth.

Parabolic Light from The Sky ☀️ ₿ ☀️Hello, hello, hello, crypto champions! 🎉🚀💱
What a fantastic last few days! Suddenly the FUD became FOMO and everyone is looking at Crypto (Blackrock and the rest, even FED Chair Jerome Powell says "crypto appears to have staying power as an asset class."). .. check the idea below on how we bought the SEC-FEDS FUD last week ₿☀️
Light from the sky
🔍 That's the sunlight accidentally through my hand, drawing a perfect parabola. No photoshop and no Ai, just timing.
What a marvelous sight, isn't it? Today, that ray of light reflects the path of Bitcoin and crypto soaring skywards in a triumphant parabola.
Even nature is celebrating our market highs! ☀️🌈 ₿
Alright, enough with the imagery, let's now put on our thinking on what matters:
Trading Psychology! 🧠💡
Remember my friends, 💙 trading is a game. Like every game, there are victories and there are losses. But isn't that what makes it so thrilling? The unpredictability, the highs and lows, the roller coaster ride of emotions?
As we navigate through the charts, we should always remember to enjoy the journey. Embrace the market's rhythm, and let it teach us valuable lessons about patience, strategy, and resilience. Trading isn't just about accumulating wins; it's also about learning how to dance with the losses. 🕺💃
Sometimes we win, and we celebrate those wins. And guess what? Sometimes we lose. And that's okay! 🎭 Each loss is not a setback, but a step forward on our path to becoming better, smarter traders. It's all part of the game.
So, buckle up! Enjoy the market's ebb and flow, celebrate your victories, and don't be disheartened by the bumps. Take each day as it comes and remember, in the world of trading, every day is a new adventure. Just don't get liquidated! Try a daily trading budget if you are in that category! 🌈🎁
Keep your spirits high and keep trading. Because trading, especially when profitable, is nothing but fun! Wins call for celebrations, but losses are just as crucial. 🎭 They aren't setbacks but stepping stones on our journey to becoming savvier traders. They're all part of this intriguing game.
Stay tuned for more insights 🎧🔮. Keep rocking the charts! 🎸📈 I'll post my analysis in the next post, so keep an eye out 👀⏭️. In the meantime, feel free to take a peek at my previous posts below 👓.
One Love,
The FXPROFESSOR 🤘💫 ₿
💡Taking some profits and waiting is a good idea at this moment. Market is still Bullish so some positions will remain open.... but some money comes in the pocket, today.

MATICUSD is rebounding on a 2.5 year old Support!Polygon / MATICUSD almost hit the Rising Support that goes back all the way to January 2021 and is now rebounding.
This is perfectly viewed on the 1week time frame where the price hit the 1week MA200.
As the 1day RSI is also rebounding, a crossing over the MA line, will confirm the bullish trend, like it did on July 4th 2022.
Buy and target the 1day MA100 on the medium term at 1.1500.
Follow us, like the idea and leave a comment below!!

MATIC long; expecting +50% in 3 weeksMATIC produced a local double top on the 4H back in March, using fib retrace from the double top you see the golden ratio has a clear support/resistance in that 0.95-0.97 (nearing the dollar) area, and for each fib retracement line you see that S/R, each one to be tested in the coming weeks as BTC and crypto assets look primed to rally.
Outside of TA; the securities definition for MATIC, along with other accused tokens, has seemingly cooled off. Not to mention the floodgates of filings and re-filings of ETFs from big dogs have opened!
