Matic

maticFor spot buying in two areas, with the specified loss limit. If you made the purchase in the first area, and you wanted to average, the second area and the second loss limit will be activated.

MATIC/USDT Technical Analysis For Long SetupMATIC/USDT Technical Analysis for Long Scalp: Targeting $1.30
Polygon (MATIC) has been a popular cryptocurrency lately, with its price showing a bullish trend. In this technical analysis, we will examine MATIC/USDT's current price, identify potential entry points for a long setup, and provide price targets for traders to aim for.
Technical Analysis:
At the time of writing, MATIC is trading at $1.1682. If BTC becomes volatile, we could see an excellent entry point around $1.14-$1.16 for a long setup. The first target for this trade would be $1.20, followed by $1.24 and $1.30. If any 4H candle closes below $1.114, traders should exit the trade to prevent further losses.
Takeaways:
MATIC/USDT is currently trading at $1.1682
The potential entry point for a long setup is around $1.14-$1.16 if BTC becomes volatile
The price targets for this trade are $1.20, $1.24, and $1.30
The stop loss for this trade is $1.114
Conclusion:
This technical analysis suggests that MATIC/USDT is currently bullish, and traders could benefit from a long setup with an entry point of $1.14-$1.16. By following the suggested targets and stop loss, traders can manage their risk and potentially earn profits. However, it is important to remember that this is not financial advice, and traders must do their own research before investing in any cryptocurrency. Happy trading!

MATIC/USDT 4HInterval Resistance and SupportI invite you to review the MATIC chart in pair to USDT, as before on the four-hour interval. First, we will use the blue lines to mark the downtrend channel where the price is moving sideways from the downtrend line.
Moving on, we can move on to marking support areas when we start a larger correction. And here we are approaching a strong support zone from $1.13 to $1.10, however, if the price goes lower we have a second strong support zone from $1.06 to $0.94, and then we can mark the support line at $0.94.
Looking the other way, we see that the price hit the important resistance zone from $1.18 to $1.26, where it immediately turned around. However, if we manage to break out of this zone above, we have the second resistance at $ 1.33, and then the third resistance at $ 1.44.
Please look at the CHOP index, which indicates that the energy on the 4-hour interval has been used, the MACD indicates the maintenance of the local uptrend, while the RSI shows a strong rebound right after crossing the upper limit of the range.

MATICUSDT - achieved the ALL TARGETS +147.2% ROE with 20xI congratulate everyone who opened this position. They reached all the targets and completely closed the position.
MATICUSDT - achieved the first target +69.6% ROE with 20x
MATICUSDT - Well goes from htf
MATIC longMATIC broke trough the descending trendline. Asset broke trough the resistance level. Bullish movement to resistance level at 1.242 is expected to happen.

MATIC - Keep an eye on this level!! Here's a quick look at MATIC 8 hr. chart.
The idea is: Buy when the price breaks above 1.148$ and take profits at the levels shown in the chart.
Targets:
1. 1.165$
2. 1.190$
3. 1.230$
4. 1.290$
-------------------------------------------
About our trades:
Our success rate is notably high, with nine out of ten of our posted trade setups achieving at least their first target upon a breakout price breach. Our TradingView page serves as a testament to this claim, and we invite you to verify our results firsthand.
-------------------------------------------
If you like the content, then make sure to comment and like the post :D
Follow me for daily profitable trading setups.
BTC dictates the market. If BTC falls, then Alts will drop as well. Trade safe!

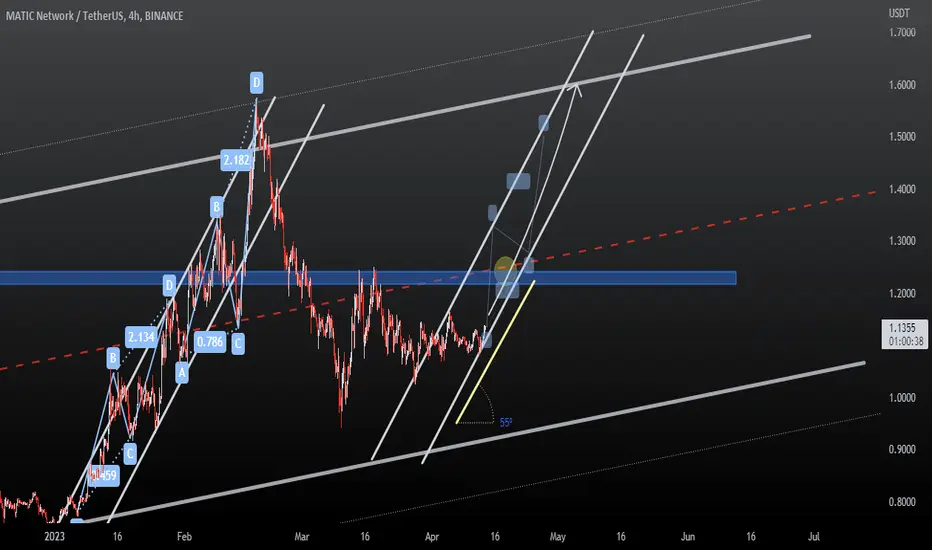
MATICUSDT Idea | a Bullish TrendA mental plan, and analysis based on a Macro ascending channel and upwards mini channels with slopes of 55 degrees.
The duration of this upward movement is 7 days at most and it is a long-term trade with 40% profit..
BINANCE:MATICUSDT MATIC NETWORK vs USDT and USD
⚠️🚨 Risk warning, disclaimer: the above is a personal market judgment and analysis based on published information and historical chart data on The trading view,
And only some of these analyzes are my actual real trades.
I hope Traders consider I am Not responsible for your trades and investment decision.
✅ Please write any advice or suggestions.
ALTCOIN SHHOPING. KAVA, LTC, MATIC, KNC, WRXIn this idea I gathered 5 interesting to buy altcoins for today, where a set-up to buy was formed. This is not 5 different trading ideas, but one, because if the growth of altcoins will be all, and vice versa, when correcting, there is a probability of getting 5 stops. Therefore, if you trade any of these instruments, you can take a closer look and choose one.
KAVA
Higher low + double bottom, price at support + short stop, good reserve for the price increase to the region of 1.05-1.15
LTC
Pushing up to the level. Looks good on a breakdown of the 95$ area with targets 100-110-115, a stop can be hidden under 85$.
MATIC
Higher low + breakdown of the downtrend, volume growth on H1+good price margin. Stop can be hidden under $1, the profit target is 1.2-1.3
KNC
Pushing the price to the level of 0.75, looks good for a breakthrough, stop is appropriate for 0.65, the profit targets at 0.82 and 0.95 is an update of the local high
WRX
A squeeze to the level of 0.18-0.185, false breakdown of this zone, most likely the price will go higher. Stops under 0.155. Take profit targets at 0.215 and 0.25-0.29
Support the author subscribe ✅ and start rocket 🚀.
Good luck and profit to all.

MATIC (Polygon) last resistance before 2$!#MATIC / USD Update:
CRYPTOCAP:MATIC is currently trading at $1.089
According to Coinlion Trend Trader Indicator, MATIC is currently bearish. Short alert at $1.17 (3th of March)
Reminder last bull run from $0.85 (01/11/2023) till the $1.26 (02/25) with plenty of Profit alerts (60-80%)
Now we are shorted MATIC
There is a buying pressure between $1.02 and $1.04
We might touch the bottom of the ascending channel around 1$ and take some profit (which is also the 200SMA) before pulling back (we hope) to 2$.
But we need to follow the rules and the Coinlion Trend Trader Indicator
What do you think ?
Please click LIKE button and Appreciate my work.
Coinlion Trend Trader indicator tells me
- When to enter short or long
- When to exit and take profit :-)
If you want it or my SL indicator or My Liquidity Support and Resistance Indicator, let me know or check our website.
Thank you.

MATICUSD one last pull-back before the $1.80 targetPolygon (MATICUSD) has been trading and closing below its 1D MA50 (blue trend-line) since March 02. It is within a Channel Up, repeating an easily recognizable pattern every time it drops and prices the Channel's Low for the ultimate buy. Currently, there is one last pull-back leg left on or slightly below the 1D MA200 (orange trend-line) in order for the 1D RSI to turn oversold around 30.00, before the new Low is priced. We will buy this pull-back and target $1.80 on the long-term.
-------------------------------------------------------------------------------
** Please LIKE 👍, FOLLOW ✅, SHARE 🙌 and COMMENT ✍ if you enjoy this idea! Also share your ideas and charts in the comments section below! **
-------------------------------------------------------------------------------
💸💸💸💸💸💸
👇 👇 👇 👇 👇 👇

MATICUSDT - achieved the first target +69.6% ROE with 20xMATICUSDT - achieved the first target of +69.6% ROE with 20x
I usually move the stop loss to no loss, but in this situation I will watch the process to control my risks.
Thank you all for supporting my reviews and positions
MATICUSDT - Well goes from htf

MATICUSDT 1D LONGMatic is forming a Diametric pattern. Time and Price resemblance between the legs, make this scenario more valid.
Of course we use money management and proper stopLoss. Let's see how it goes.

🔥ONE MORE PULLBACK TO PUMP CARDANO ABOVE HIGHS: THE 3 TARGETS!🔥Hi, friends! Cardano like most of altcoins follows the BTC. I expect one more BTC pullback, so ADA can go lower too. I think that Cardano will pump by +20% at least.
📊 TRADING PLAN FOR ADA:
1. pullback to $0.345-0.3 value area
2. volume growth confirms that the bottom reached
3. bullish BTC
🚩 One more scenario is a pullback below to the $0.32-0.33 value area. It's a deeper pullback that will take the most long traders sl out.
✅ THE MAIN TARGETS FOR ADA:
🔥 $0.42 - the key level and local high
🔥 $0.44 - the key level
🔥 $0.50 - the key level and even number
Traders, what is your favorite altcoin to trade? Which altcoin should I pay attention to? Write in the comments!
💻Friends, press the "boost"🚀 button, write comments and share with your friends - it will be the best THANK YOU.
P.S. Personally, I open an entry if the price shows it according to my strategy.
Always do your analysis before making a trade.

MATIC/USDT 4HInterval Resistance and SupportHello everyone, let's look at the MATIC to USDT chart on a 4-hour timeframe. As you can see, the price is moving in the local uptrend channel.
Let's start with the support line and as you can see the first support in the near future is the zone from $1.12 to $1.11, if the support is broken then the next support is $1.09 and $1.05.
Now let's move on to the resistance line, as you can see the first resistance is $1.13, if you manage to break it, then we have a resistance zone from $1.15 to $1.16, then support at $1.17 and $1.19.
Looking at the CHOP indicator, we see that the energy is growing strongly, the MACD indicates a local downtrend, while the RSI has a significant rebound, which creates room for the next increase.

MATIC - Trend-Following Setup 🏹Hello TradingView Family / Fellow Traders. This is Richard, also known as theSignalyst.
MATIC has been overall bullish trading inside the rising broadening wedge in blue and is now retesting the lower bound.
Moreover, the zone 0.95 - 1.0 is a strong weekly support zone .
🏹 So the highlighted purple circle is a strong area to look for buy setups as it is the intersection of the blue support zone and lower red trendline. (acting as a non-horizontal support)
As per my trading style:
As MATIC approaches the lower purple circle zone, I will be looking for bullish reversal setups (like a double bottom pattern, trendline break , and so on...)
📚 Always follow your trading plan regarding entry, risk management, and trade management.
Good luck!
All Strategies Are Good; If Managed Properly!
~Rich

$MATIC looks bearish for the long term$MATIC looks bearish for the long term 📉💸 #cryptocurrency #analysis #MATIC

🔥ALTERNATIVE BULLISH SCENARIO FOR BTC: PUMP AFTHER PULLBACK🚀🔥Hi, friends! A lot of analysts now think about the next BTC move. I can say that BTC is still in a bull trend, but the market is overheated and need to make a pullback to recover.
You can see it by the bearish divergence on many indicators, the trend angle and new sell orders at the highs using DOM and Footrpint.
I take a 2020 Bitcoin price pattern to predict the next BTC move. I don't expect new highs in 2023, but mid-term growth is highly possible.
I mention the 2 areas which will become strong support:
✅ $25,200-26,400 - the value area where many long sl are placed and the top of the global channel. The price will not fall lower with the high possibility.
✅ $22,650-23,850 - the second critical value area. The price will fall here if lot's of bad news appeared on crypto or stock market.
✅ THE MAIN LONG TARGETS FOR BTC AFTER THE PULLBACK:
1. $32,000-38,000 - the highly probable targets in the current market conditions.
2. $45,000-48,000 - the max targets for BTC if only the entire world economy will fill well.
Remember that the market is still in a bull trend and the April is one of the most profitable months for Bitcoin.
💻Friends, press the "boost"🚀 button, write comments and share with your friends - it will be the best THANK YOU.
P.S. Personally, I open an entry if the price shows it according to my strategy.
Always do your analysis before making a trade.

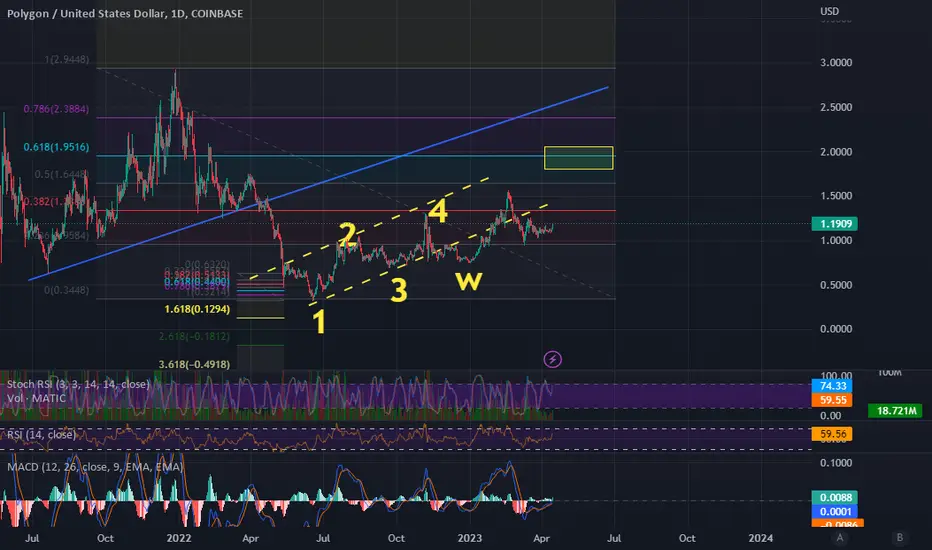
Another Look At MATICCurrent thoughts are bullish on MATIC as they are across the majority of the crypto space
I have tried to show my thought process about the pattern that is playing out with the 1,2,3,4 labels
Breakout from this small up channel is inevitable

Trade Alert - Long MaticTraders,
I'm OoO and operating completely from my mobile phone rn. But couldn't help but spot this beautiful bull Flag on matic which has exited to the top side of a descending tl and after touching our 100 day ma. I'm hoping to hold this trade to the 50 day (currently $1.19) and to a level above that at $1.32
Stew

MATIC on the MoveMATIC is currently trading at $1.1091, with a slight drop of -0.78% in the last 24 hours. On the 4-hour timeframe, the asset is hovering above the $1.1003 support level, but below the $1.1280 resistance level. The asset is experiencing moderate volatility, as it trades within the upper and lower Bollinger bands, with $1.1032 being the middle ground.
The volume oscillator suggests that traders may not be as interested in MATIC at the moment. The MACD is showing little to no momentum, while the Stochastic oscillator is indicating that the asset may be overbought.
The 4-Hour EMA 50 is at $1.1031, which further suggests that this level could act as a support level for the asset.
In summary, MATIC is currently facing resistance to moving up but has support to remain stable. The asset is experiencing moderate volatility, and the current trading volume indicates less interest from traders. The MACD suggests little momentum, while the Stochastic oscillator suggests potentially overbought conditions. The 4-Hour EMA 50 further supports the idea that $1.1031 could act as a support level.

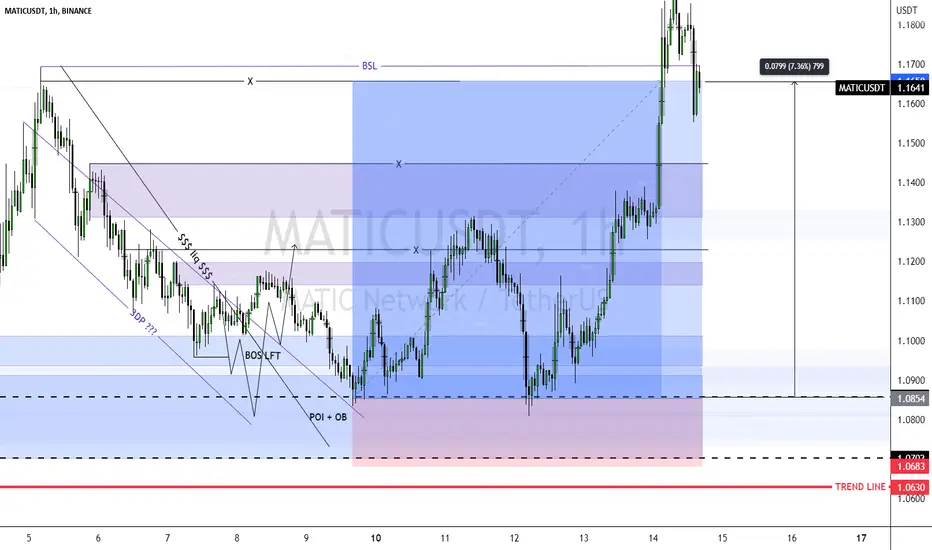
Matic, possible break of the trendline As you can see on the picture we have zones of imbalances below, that needs to be covered.
How i see this scenario is a bounce of the POI and break of the trendline
Planning to enter this position only in case the trend line will be broken and retested
DYOR, and good luck in your trades
