Liverpool x MATICshocker here, as soon as Liverpool sign a partnership with MATIC, the crypto suffers and 80% drop in asset value. that's what happens when you partner with a broken company owned by LeBron.
Matic

MATIC/USDT WEEKLYHello traders, a new week is upon us!
#MATIC update with a look at the weekly candles.
We have formed a bearish engulfing candle formation after which a move down is very likely.
I will definitely look for short entries on the smaller time frames after the confirmation of the trend down to levels around 0.59.
Dollar Index in today London session lifted and currently goes up, if it breaks the current recent last low and maintains this level, this prediction could be confirmed

#Matic | #UsdtMatic/Usdt broke below the important S/R Trendlin
_________________________________________________

Matic overheatedShort matic stop loss 1.02 or 97 or 94.5
---
Take profit 88.7 or 86
---
Low leverage

✴️ Polygon Has Bullish Potential | Can Grow 100%+Ever since the 18-June low, Polygon has remained strong and the lowest level hit after the early November price peak is above the 0.618 Fib. retracement level...
Let's dive into this chart.
Feel free to boost 🚀 to show your support.
Now, volume is a strong indicator we say but there is also another signal that is important to keep in mind.
We will call it the chart structure or stability.
Notice how MATICUSDT has been trading within a stable range after recovering from the June/July drop. This is a signal of strength.
When we had a strong injection of bear volume, prices remained trading above the Fib. 0.618 support level.
This whole phase is considered consolidation...
Consolidation happens before a price jump.
MATIC looks good, it can produce additional growth.
But keep in mind that the charts can always change.
That's why we have a plan, follow a strategy and use a stop-loss if we decide to trade.
Thank you for reading.
I hope you are enjoying the content and find it useful for your growth, learning, success and trading.
Namaste.

MATIC on the verge of a breakdownMATIC has a good downside potential, worth it IMO.
Touch of the Mid Channel + Trendline about to be broken.
NFA.

$MATIC - High time frame MATIC Looks Heavy at this point,
If we manage to close below the trend line and make a clean break below $0.7 then most likely it's heading towards lower levels around $0.4.
Adding confluence with DXY Holding support and might Rally towards 108 level and BTC Might take out the equal lows in coming weeks, so worth keeping an eye on matic/usdt.
Cheers

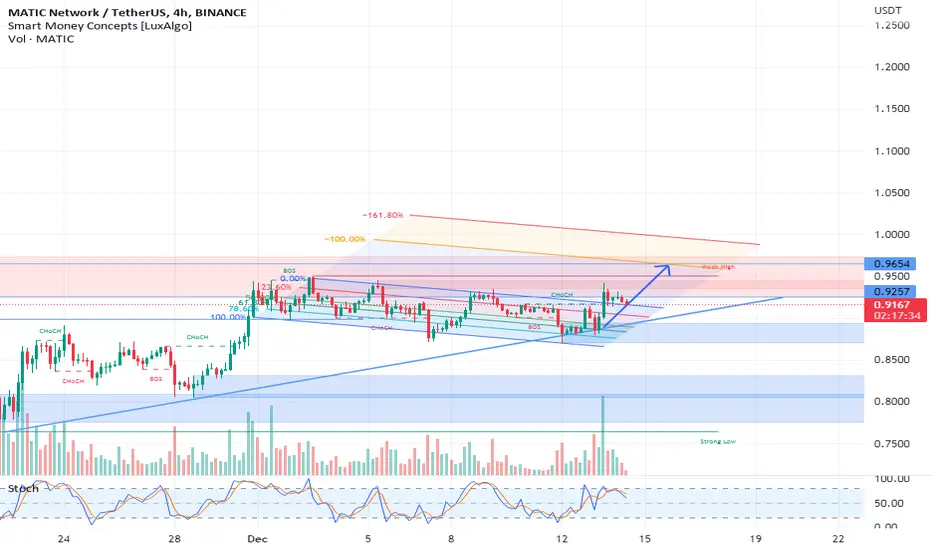
MATICUSDT 1HMATIC clearly formed a triangular wedge and we stressed the base of this wedge in the morning, so our next resistance becomes 0.8053, now the quote is at 0.7938.
MATIC should not break its supports because it is respecting the base of the triangular wedge, fundamentally it is one of the altcoins with the highest institutional contribution, with several institutional giants contributing programming codes to this ecosystem.
Here are the supports and resistances:
S: 0.7899 / 0.7824 / 0.7774 / 0.7707
R: 0.8054 / 0.8209 / 0.8678 / 0.8895 / 0.8959

MATIC CAN DROP MOREI hope you are fine
According to the change of structure and substructure area, I think that matic may fall more.
If we reach the FVG zone, I will look for SELL/SHORT trades.
Comment if you have any questions
Thank You

CRYPTO | MATICUSDT -DECRYPTERSHi people , Greetings from Team Decrypters We are Still Bearish on Over all Crypto Assets Due to Pending Downside leg of stocks Towards Pre-covid Levels & Pending liquidations of Big players

MATIC : Red Flagged Trade at least for the short term?Are we on the process of a megaphone pattern formation? This is just a thought and needs many more confirming indicators and market movement. Let's wait for some developments and I will update the chart. Stay Tuned.

InvestMate|MATIC Strong Support Zone Ahead💲💲MATIC Strong Support Zone Ahead
💲Compared to many cryptocurrencies, Matic has not dropped significantly during the recent declines.
💲There is a strong support zone ahead, determined by a very strong fibo level of 0.618
💲I expect some kind of reaction there.
💲For now, more time and a renewed attack by buyers is needed to talk about the continuation of the uptrend.
💲The scenario I'm playing out is to watch how the price reacts to the support zone, and wait for a renewed bullish attack. I'm aware of the possibility of a correction at any time, this should be taken into account, If the outlook changes I will publish a post with an update, so I encourage you to actively follow the profile and read the description carefully.
🚀If you appreciate my work and effort put into this post then I encourage you to leave a like and give a follow on my profile.🚀

MATIC LOOKS AS BEARISH AS BITCOIN !!!Recently, I posted a view on bitcoin. And here we have the Matic.
The whole structure seems that a huge drop may happen soon. Do not forget to add sl on your positions.

Matic to continue downtrendSimilar to the macro conditions with BTC and ETH, Matic has a blood diamond on daily chart. I expect a 4 to 9 bar continuation to the downside. This gives us a price target of 0.71
MATIC/USDT 1DAY UPDATE BY @CRYPTOSANDERSHello, welcome to this MATIC/USDT 1DAY chart update by CRYPTO SANDERS.
I have tried to bring the best possible outcome to this chart.
CHART ANALYSIS:-Polygon (MATIC) was another notable token to fall today, with prices also moving lower for a third straight day.
Following a high of $0.891 on Thursday, MATIC/USD dropped to a bottom of $0.8483 earlier in the day.
As a result of this drop, the polygon moved to its lowest point since November 30, when prices hit a bottom of $0.837
MATIC has since rebounded from earlier lows and is currently trading at $0.8569, which is still nearly 4% lower than Thursday’s floor.
This slight rebound comes as the RSI rejected a breakout of a point of support at the 43.00 level, and the index is currently at the 44.26 mark.
Historically, bulls have used this floor as a point of reentry, and should this reoccur, then we could see MATIC move back toward the $0.90 level.
This is not a piece of financial advice.
Hit the like button if you like it and share your charts in the comments section.
Thank you


Trading opportunity in MATICUSDTBased on technical factors there is a Sell position in :
📊 MATICUSDT
🔴 Sell Now or by Setup
🧯 Stop loss 0.8680
🏹 Target 1 0.7925
🏹 Target 2 0.7355
💸RISK : 1%
We hope it is profitable for you ❤️
Please support our activity with your likes👍 and comments📝

MATICMatic bottoms around .20c IMO. The triangle/diagonal is very constructive & makes me think MSTIC can lead the next altseason 2023.
I've been charting this for many months now in my group & we are waiting for this juicy op. ;)

WILL $MATIC BOTTOM AT $0.37 BEFORE THE BULL RUN STARTS?Polygon- A fundamentally strong ecosystem that has been bridging the gap between Web 2 and Web 3 by onboarding new users through various partnerships. $MATIC is the native currency in the ecosystem.
The answer to the question in the title is most probably. With this said, lets dive into the analysis below:
The current macroeconomy is bearish which limits the growth potential for majority of the asset classes including the Crypto market. This limitation results in fundamentally strong coins/ tokens to stagnate or decline in price. This enables us to position ourselves accordingly for the next bull run. Now we take a look at how we can position ourselves using technical analysis (Pure Price Action).
My confluences for expecting lower prices for $MATIC:
- The macroeconomy is looking bearish for the coming months.
- There is a clear Fair Value Gap between $0.60- $0.68 which will very likely be filled before any rally.
- There is Sell Side Liquidity below current price denoted by the $ sign that are attractive for smart money to raid.
- There is a Bullish Order Block that has not been tested as yet.
I will be looking to take full profit from any Short position I enter upon reaching that Bullish OB around $0.40. Long positions are set to be opened below $0.40 (preferably $0.37).
This is Not Financial Advice, this is for educational purposes only. With this said, Happy Trading Pals.

MATIC won´t be different. When to buy?Most likely Matic (Polygon) won´t be different. It will go down together with the whole crypto market.
On the chart you can see 2 possible scenarios. The direction is down.
Because of the FTX drama, the sentiment is bearish and probably it will remain bearish for awhile.
In the next days or weeks we may see more crypto firms announcing their bankruptcy therefore altcoins won´t perform well.
Welcome to crypto market!

MATICUSDT ...Don't panic...yet!#MATICUSDT
as you can see in the chart, MATIC is holding the updward momentum despite the drawdawn hapenned last night.
still bullish, until it broke the blue trendline downward...then you should panic as FK.
#saty_safe

MATIC / USDT 1D chart Resistance and SupportHello everyone, welcome to the USDT MATIC chart review. As we can see, the price has broken out of the downtrend line and now we can mark the uptrend channel in which the price is moving with the blue lines.
Now let's move on to determining the support for the price and here we see that we first have a strong support zone from $0.82 to $0.70, if the price falls below the designated zone, we can see a drop to around $0.53 and a delta to $0.32.
Looking the other way, we see that we have the first resistance at $0.94, if the price goes up, then we have a strong resistance zone from $1.32 to $1.64, only when the price breaks this zone and tests it positively, we will be able to see further increases.
Please look at the CHOP index which indicates that we have a lot of energy which, when BTC is falling, can be used for a large correction, the MACD indicator indicates that we are on the verge of entering a downtrend, while looking at the RSI it is difficult to clearly determine the direction.

MATICUSDT still healthy and doing good#MATICUSDT
if you saw the last idea of MATIC i did, you'd see how i am optimisitic about this.
NOW, we need ONE GREEN CANDLE, and off to go to the target.
#STOP_BEING_POOR