#Polygon Soars 28% From Q3 Lows, Will MATIC Breach $1?Past Performance of Polygon
Polygon could be up 28 percent from September lows, but bears are still in a commanding position. Overly, MATIC is bearish from a top-down preview and consolidating below $1. As long as the coin is trending below this psychological liquidation level and trading volumes are suppressed, traders can search for entries to liquidate. This preview can only shift once there are gains above $0.95, with traders confirming gains of late November 2022.
#Polygon Technical Analysis
At present, MATIC is consolidating. The path of least resistance in the short term appears northwards. The immediate resistance level is at $0.95, while support remains at $0.88. The optimism stems from the fact that prices are inside the November 30 bullish engulfing bar. From an effort-versus-result perspective, this is bullish, especially now that the recent bars driving MATIC lower are with low volumes. A close above $0.95 may see prices rise, roaring towards $1 in continuation of late November surges. Conversely, if MATIC sellers force prices lower, the coin could crumble, sinking to $0.80 or worse.
What to Expect from #MATIC?
Polygon is propped by solid fundamentals, looking at the performance in the daily chart. All the same, like the rest of the crypto assets, MATIC is under pressure. Ideally, a close above $1 will trigger demand. But before then, the main resistance level lies at $0.95.
Resistance level to watch out for: $0.95
Support level to watch out for: $0.88
Disclaimer: Opinions expressed are not investment advice. Do your research.
Matic

MATIC 4H ANALYSIS Matic very well project.
Resistance $0.90 ,0.95,$1
Support $0.85
Matic trying $1 Breakout.
Matic Long Term Vision $5
Matic

Large limit order in order book. Time to sell!A local level with three approaches has been formed. On the round number 0.88 in the spot order book there is a large limit order.
I recommend going in on the acceleration of prints in a glass and in the corrode of density on the spot.

Can MATIC be supported on the HA-High line...Hello?
Traders, welcome.
If you "Follow", you can always get new information quickly.
Please also click "Boost".
Have a good day.
-------------------------------------
(MATICBTC 1W chart)
If the price holds above 0.0000 5049, it is likely to explode the upside force.
---------------------------------------
(MATICUSDT 1W chart)
On the MATICBTC chart the price is in the high range, but on the MATICUSDT chart this is not the case.
This phenomenon is caused by the price fluctuation of USDT following the fluctuation of BTC price.
Therefore, the charts we usually see and trade are the MATICUSDT or MATICKRW charts.
However, I think the MATICBTC chart serves the same purpose as a dominance chart or an index chart, showing the strength of MATIC when the BTC price starts to show an upward trend.
Therefore, even if the price on the MATICUSDT or MATICKRW chart declines, if the MATICBTC chart maintains the price, eventually MATIC will show an increase in price.
In this sense, looking at the MATICUSDT chart, it can be interpreted that if the price is maintained in the 0.6164-0.8191 range or higher, it is likely to show an uptrend.
So, if it goes up, I expect it to touch around 1.2246.
(1D chart)
The question is whether the price can hold above 0.8647 and rise above 0.9486
-------------------------------------------------- -------------------------------------------
** All descriptions are for reference only and do not guarantee profit or loss in investment.
** If you share this chart, you can use the indicators normally.
** The MRHAB-T indicator includes indicators that indicate points of support and resistance.
** HA SRRC indicators are displayed as StochRSI (line), RSI (columns), and CCI (bgcolor).
** The CCI indicator is displayed in the overbought section (CCI > +100) and oversold section (CCI < -100).
(Short-term Stop Loss can be said to be a point where profit or loss can be preserved or additional entry can be made by split trading. This is a short-term investment perspective.)
---------------------------------

BTC has more downsideAfter large sellofs we saw an uptrend in this channel here. With a few breaks above channel as seen by triangles and dipping back into the channel it gives me some indication that it doesnt have what it takes to stay above that upper trendline and cannot break above this resistane channel. Each break above decreased in size and failed to do so in the last attempt showing weakness. I am expecting a breakdown.
Trade safe have fun!
Like and follow for more like this!

MATIC - Technical review and analysisFor the short term, due to the formation of higher ceilings and floors in the 4-hour timeframe, and until the uptrend line drawn on the chart is maintained, further price increases are expected. But if the uptrend line and static support are broken, a drop to the $0.750-$0.790 support range is expected.

MATIC/USDT (looking bearish)#matic
i am taking short at 9.490
sl at 0.9758 2.5%
tp 0.8570 10%
matic will be soon no more moon :)

MATIC SHORT IDEAPlanning on shorting MATIC / USD around the 4H FVG on the top of the chart
* Would expect price to strongly pump and spike into that area since there is a lot of liquidity above the current price.
* This predicted move could be seen as deviation above range high
* When getting back into the range, I would target range midline and range low

MATICUSDT to the moon!#MATICUSDT
MATIC is about to explode...if the pair managed to cross the upper fib-parallel channel , it will reach the next level at 0.965
so please stop being poor!
brace yourselves
#stay_safe

MATIC usdt - rises and fallsSeems to be a recurring trend with MATIC right now, here we see a series of rises curbed by resistance and downtrends.
Price still above EMA's.
Expect to see more, but it still certainly is a good long (long term).

MATICUSD Non-Log Trend Line Drawing a trend line between two strong flag like structures
The first prior one popped off greatly, will we see something like this for the second flag structure?
Post to support my prior Analysis that got a few views the other day

MATIC The Scenario Is coming to Realisation💲💲MATIC The Scenario Is coming to Realisation
💲We have dropped into the support zone exactly as I predicted in my last post:
💲Is it time to go up?
💲Everything looks like it.
💲After falling to the support zone I set last time.
💲If we break through the nearest resistance zone and start a continuation of the increases.
💲The strongest resistance zone around 1.06 is within reach.
💲The scenario I'm playing out is a continuation of the increases to the levels of the strong support zone marked on the chart. I'm aware of the possibility of a correction at any time, this should be taken into account, If the outlook changes I will publish a post with an update, so I encourage you to actively follow the profile and read the description carefully.
💲*Please do not suggest the path I have outlined with lines it is only a hypothetical scenario.
🚀If you appreciate my work and effort put into this post then I encourage you to leave a like and give a follow on my profile.🚀

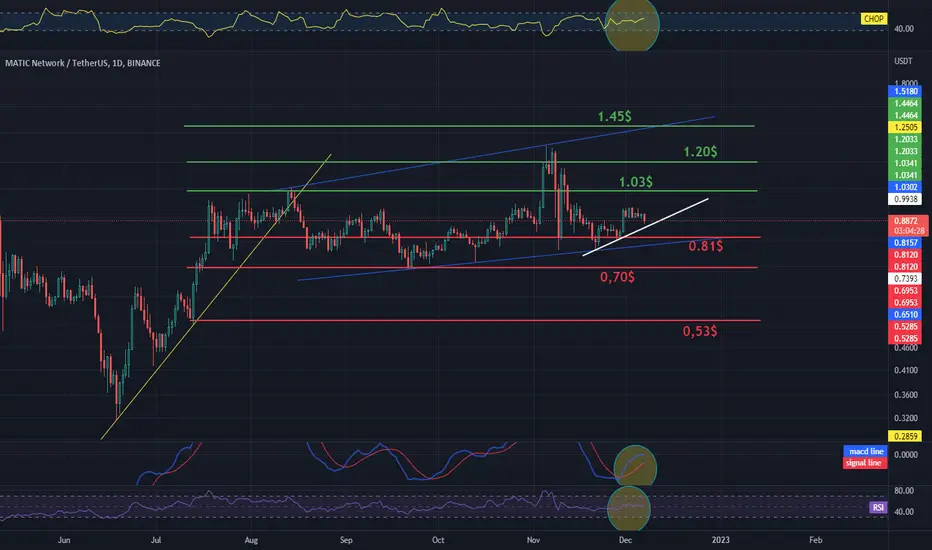
MATIC / USDT 1D chart Resistance and SupportHello everyone, let's look at the MATIC to USDT chart on a 1 day time frame. as you can see, the price, after a fairly large drop, started to return along the uptrend line and gave an increase of 227%, and then began to move in the sideways trend channel.
Now let's look at what supports MATIC has on its way and we see that we have the first support at $0.81, the second support at $0.70 and the third support at $0.53.
Looking the other way, we will check resistance points for the price that we should take into account in the longer term. The first resistance is at $1.03, the second at $1.20 and the third at $1.45.
It is also worth marking the local uptrend line above which the price is still holding.
As you can see, the CHOP index indicates that the energy is highly charged, the MACD indicates that we are in an uptrend, and the RSI shows that we are in the middle of the range, which may indicate a further sideways trend.
MATICUSD Repost (It Reminds Me) MATIC Definitely reminds me of an early Ethereum in many ways
This chart furthers that
Structure with labels 1,2,3 can be seen in early ETH chart
This structure is current on MATICUSD
Will we catch a 13000% move on MATICUSD? As was seen on ETH?

#MATIC SHORT (Triple Top)BINANCE:MATICUSDT This looks like a great entry for a low/medium leverage (5-10x) Short.
*This is not financial or investment advice.
BINANCE:MATICUSDT

MATIC is in danger, it will DUMP hard!Hello, everyone!
Let’s continue to analyze the most dangerous altcoins which showed the greed during the bounce on the Bitcoin. Today it’s MATIC time. It now has the most dump potential. I suppose that the market maker created the fake growth on this altcoin to show other traders the illusion of the asset’s power. Of course it’s fake and MATIC is going to break or at least test it’s bottom at $0.33 and I will show you why. Let’s go!
Let’s take a look at the 1D time frame of the MATICUSDT of the WhiteBit exchange. The bottom at $0.33 was the end of the wave 3 as on the entire crypto market. The corrective wave 4 retraced this wave with the zigzag correction. Zigzag correction usually consists of wave A (5 waves), wave B (3 waves) and wave C(5 waves). You can see on the chart how perfectly the market structure for MATIC corresponds to this theory. One question you can have is why the wave 5 did not break the wave 3 top in the wave C. I can explain it because wave 5 could be trimmed. It’s OK for the altcoins.
Now the price is drawing the wave 5 and I suppose the the sub wave 3 of this wave is in progress. The minimal target for the wave 3 is the $0.61 – 1 Fibonacci extension level, but I think MATIC will hit $0.3 again because the 1.61 Fibonacci placed right here.
Best regards, Ivan
_______________________________________________________________________
Guys, if you like my analytics, please support me with your boosts and comments!
