Matic Coin Analysis: Potential Gains of 13x, During Alt SeasonMatic coin currently holds a strong support level between $0.48 and $0.49. This level presents a promising opportunity for significant gains as we enter the altcoin season. Historical data suggests that if this support holds, Matic could potentially reach a minimum target of $3.415, offering an impressive gain.
However, if the $0.48 to $0.49 support level is breaking, the next major support can be found between $0.29 and $0.31. This level is crucial for Matic's long-term stability.
During a bullish alt season, Matic has the potential to soar even higher. Based on historical trends, the maximum target could reach up to $6.47, representing an extraordinary return of nearly 13x from the current support level.
For more detailed analysis and updates, follow us on TradingView to stay informed about our latest trading ideas. Don't miss out on potential opportunities in the crypto market!
Matic

Matic Swing Trade IdeaSwing trade idea.
Asset: Matic
Bias: Long
Confluences:
•Fibonacci golden pocket/.786
• Loss of the value area low (likely a bullish loss of VAL-commonly mistaken as a fake out/liquidity grab
•Formation confluence (descending channel @ 4hr broadening wedge )
•Market cipher confluence on lower hourly timeframes (anchor wave confirmed on the 1hr + 30m bullish divergences.) Daily bullish divergence with 2D bull divs printing.
Entry Details:
I’ll be looking to enter on multiple drives of 3m bull divs + 6m bull divs.
Entry Zone: .5490-.5295
Stop loss: .5280
TP1: .5527 (VAL/1:1)
TP2: .5712 (POC)
TP3: .5824 (VAH)
TP4: 5973
TP5: .6290
TP6: .6807 (pVAL)
TP7: .7244 (pPOC)
TP8: .7414 (pVAH)
Concerns:
Swing Failure Pattern (SFP) is a possible. I will consider entering on a sweep of the previous wick even after getting stopped out. As long as you are risking 1-3% the win will outweigh the loss tremendously over time.

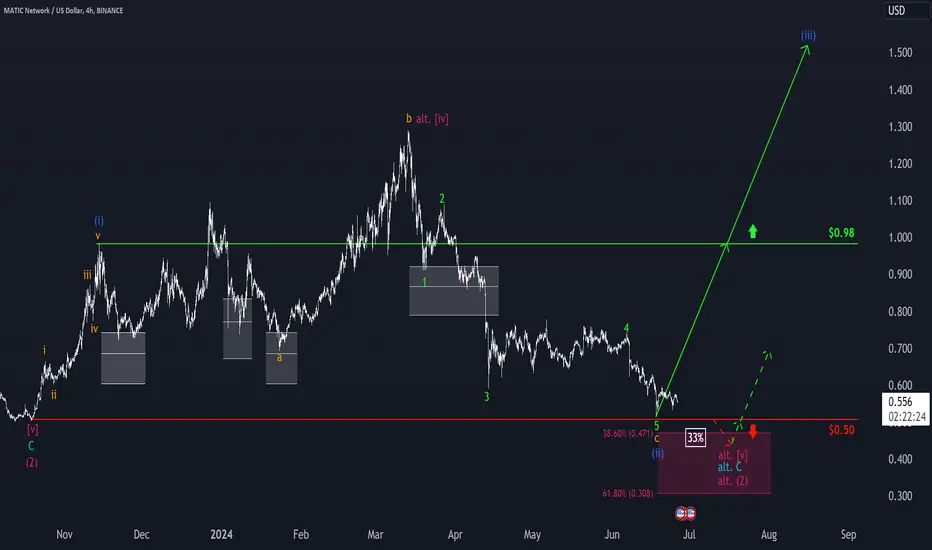
MATIC: Start-Up DifficultiesMATIC struggled to achieve clear upward momentum last week. The bears slowed the coin down, so that it is trading slightly lower today than at the time of our last update. Nonetheless, we still see the price in the blue wave (iii). During this wave, we expect it to rise well above the resistance at $0.98. If, on the other hand, there is a fall below the support at $0.50, we will have to assume a still ongoing wave alt.(2) in magenta, which would first require a setback into our same-colored Target Zone ($0.471 – $0.308).
MATIC is Approaching An Interesting ResistanceHey Traders, in today's trading session we are monitoring MATICUSDT for a selling opportunity around 0.5830 zone, MATICUSDT is trading in a downtrend and currently is in a correction phase in which it is approaching the trend at 0.5830 support and resistance area.
Trade safe, Joe.

MATIC NETWORK FED WILL CAUSE BIG CRASHBlackrock CIO already mentioned hours ago that FED wil hike the rates.This is panicing themarkets..and it is just the beginning. Entries and Take profit levels see on chart above

MATICUSD - Strong Horizontal Support LevelExcluding the low at the labels price .31, MATIC has reached a strong horizontal support level that has seen bounces off it repetitively.
As I think we are entering a larger bull market this could be a great entry point for the bulls.
Simple Support Analysis.
Daily Chart.

MATIC Weakness: 2-Year Pennant BROKENAfter a massive pump last cycle, MATIC is one of the weaker bigger alts on the market. It has given away all of the gains made since the October 2023 bull move and is not looking like it will stop dumping. The pennant pattern that has been holding for over 2 years has been broken.
I'm looking at the yellow area for a potential long-term entry. Patience is key.

MATIC Network AnalysisMATIC not only performed exceptionally well in the previous bull market but also held up strongly compared to other altcoins in the bear market. I consider $0.37 as the main support level, with ultimate targets of $3 and $10. DYOR

Can we get a golden opportunity soon?So there are a few things that I noticed, and it could be a great opportunity to consider either SPOT or FUTURES trading. As you can see BINANCE:MATICUSDT was holding an uptrend channel it has been a good support since June 2022. Looks like it is breaking down which is a very bad sign to go down further, but there is a major support zone at 0.3-0.35 area. This support zone must hold it otherwise we might even see a 0.05 area. The closing candle around 0.485 will be 3rd BOS (break of structure), and confirmation to continuously
go down. I will consider Long trade around 0.3-0.35 area.

MATIC IS AT CRUCIAL SUPPORTMatic is trading at a crucial support level and needs some buyers to come in or we can move much lower. Great area to DCA and hold if you believe in this company long term.
Calculate Your Risk/Reward so you don't lose more than 1% of your account per trade.
Every day the charts provide new information. You have to adjust or get REKT.
Love it or hate it, hit that thumbs up and share your thoughts below!
This is not financial advice. This is for educational purposes only .

#MATIC/USDT#MATIC
The price is moving within a descending channel pattern on a 4-hour frame, which is a retracement pattern
We have a bounce from a green support area at 0.6000
We have a tendency to stabilize above the Moving Average 100
We have a downtrend on the RSI indicator that supports the rise and gives greater momentum and the price is based on it
Entry price is 0.6270
The first target is 0.6582
The second goal is 0.7218
The third goal is 0.7742

These ALTS can still EXPLODE - ALTSEASON 2.0Missed the rallies? Don't worry! Here's a list of alts that still has BIG UPSIDE Potential!
1) CROUSDT / OKX:CROUSDT
2) LINK / BINANCE:LINKUSDT
LINK is 53% from the FIRST TP point... and still an incredible amount of upside beyond this point:
3) MATIC / BINANCE:MATICUSDT
MATIC is about to retest a very important support zone for the third time, and a triple bottom would be significantly bullish (IF it holds):
4) Fantom / BINANCE:FTMUSDT
FTM seems bearish for the short term, but it's over 400% away from the previous ATH! There great upside potential her is you have some patience. I'd be looking to buy in the yellow zone:
5) Litecoin / BINANCE:LTCUSDT
And last but not least, Litecoin as seen on the front chart. LTC is about to re-enter the accumulation zone, where it normally doesn't stay long - it could consolidate here for some time, but upside is usually the next logical step after Litecoin enters the accumulation zone.
Again, you may need some patience but if you're willing to hold you could score big time on these altcoins!
_______________________________


MATIC Nears Crucial Support Level: Key Insights and Triggers🔍MATIC (Polygon) is approaching a critical support level. Here's an in-depth analysis to guide your trading decisions.
📆Coin of the Day: MATIC (Polygon)
About the Project
MATIC is a layer-2 scaling solution for Ethereum, known for its low transaction fees and extensive use in the DeFi space.
🧩Technical Analysis
4-Hour Timeframe
This analysis focuses on futures trading, highlighting multiple scenarios.
📉Support and Resistance: The price has reached the bottom of its consolidation range, with key support at $0.6449. A confirmed break below this level could signal further downside. The immediate resistance levels are at $0.6676 and $0.7491.
📈Bullish Scenario: If MATIC can hold above the $0.6449 support level and Bitcoin stabilizes, a potential bounce could occur. Key resistance levels to watch are $0.6676 and $0.7491. A break above these levels would indicate renewed bullish momentum.
📉Bearish Scenario: Bitcoin has recently been rejected from a significant supply zone, contributing to MATIC's decline. A break below $0.6449, confirmed by a retest, could lead to further downside, with the next support level at $0.5057.
📊Volume and RSI: Volume has been decreasing overall, except for a significant sell-off candle recently. The RSI has broken down, indicating bearish momentum. Key RSI levels to watch are 24.46 and 23.29 for potential oversold conditions.
💡Key Triggers: Monitor the price action around the $0.6449 support level. A break and retest of this level could provide a clear signal for further downside. Conversely, a hold above this level, coupled with stabilization in Bitcoin, could trigger a potential bounce.
👨💻Trading Positions
Long Position
Entry Trigger: Hold above $0.6449 with confirmation from RSI and volume.
Strategy: Open a position on the hold of this level, targeting $0.6676 and $0.7491. Use tight stop-loss orders to manage risk.
Short Position
Entry Trigger: Break and retest below $0.6449.
Strategy: Open a position if the price confirms a break below this level, targeting $0.5057. Adjust stop-loss orders accordingly.
📝MATIC is testing a crucial support level, with significant implications for future price movements. Traders should monitor key levels and triggers for potential entries and exits. Volume and RSI indicate bearish momentum, while support at $0.6449 is pivotal.
🧠💼Always remember the inherent risks in futures trading, with the potential for margin calls if risk management is neglected. Stick to strict capital management principles and use stop-loss orders, ensuring an initial target with a risk-to-reward ratio of 2.
🫶If you found this analysis helpful and want to support me, please boost this analysis. Feel free to leave a comment or suggest a coin you'd like me to analyze next.

Alikze »» FIL | Big C or 3 wave scenarioIn the daily and weekly time, it is moving in an upward channel, which according to the previous analysis , the last wave had the ability to grow to around 100% of the previous wave, after which it faced correction, which was correctly mentioned in the updates of the previous post. And extended to the specified area of correction.
💎 First scenario: Therefore, if this last correction, which is extended in the form of three waves up to the green box range, is completed and its structure does not constitute a complex combination correction, we can expect a sharp super cycle of wave C or 3 from it. In the first step, it will conquer the ceiling of the previous major and after that it can touch the specified supply area.
💎 Alternative scenario: If the green box range is broken, this correction can extend further to the $4 range and then to $3.125, in which case it should be updated again.
If the behavior and structure of the post changes, it will be updated.
»»»«««»»»«««»»»«««
Please support this idea with a LIKE and COMMENT if you find it useful and Click "Follow" on our profile if you'd like these trade ideas delivered straight to your email in the future.
Thanks for your continued support.
Sincerely.❤️
»»»«««»»»«««»»»«««

MATIC/USDT A successful breakout the resistance will be bullish!💎 Paradisers, MATIC is indeed displaying intriguing movements that warrant close attention.
💎 Currently, in the accumulation phase, MATIC has shown resilience by bouncing when it reached the demand area around 0.696 to 0.675. This suggests a potential continuation of the upward movement, aiming to confront the resistance of the accumulation phase.
💎 If MATIC successfully breaks above the resistance at 0.77, it could signify a bullish momentum, potentially leading to significant upward movement with the target set at the supply zone around 0.91.
💎 Breaking above the supply zone is essential for reinstating a bullish trend in the mid-term and could pave the way for reaching our target strong resistance area.
💎 However, if MATIC faces rejection at the resistance area, it may retreat to retest the demand zone, or even descend further to the strong support area around 0.631. Historical data indicates that MATIC tends to bounce back upward when reaching this strong support level.
💎 The bullish scenario would be invalidated if the daily candle closes below the strong support area. In such a case, there's a possibility of further downward movement and deeper dips in price.
MyCryptoParadise
iFeel the success🌴

Polygon (MATIC) Polygon is the first well-structured, easy-to-use platform for Ethereum scaling and infrastructure development
Its core component is Polygon SDK, a modular, flexible framework that supports building multiple types of applications.
the Matic price has recorded more than 10% gains in the last seven days despite the broader crypto market’s sluggish conditions plus matic has been gaining daily active addresses (DAA) during this bullish price action. DAA figures spiked by over 60% in the span of just a few days. Onchain data also highlighted that over the last seven days, new addresses jumped by 12% while active addresses noted a 19.98% uptick.
usdt pair looks good but btc pair looks even better and in short period of time matic can hit 0.9 , 1.1 , 1.3 and 1.5 dollar.

MATIC has bottomed here..Think this coin has a ~15x move ahead of it..
MATIC/ETH pair has likely bottomed...
AggLayer and POL token should eventually drop giving it a nice narrative to propel it.

$MATIC GOOG TO BUY FROM HERE#MATIC is always a good buy, especially at the local lows!
I set buy orders in the orange zone, this is a long-term spot trade.
BINANCE:MATICUSDT
☺FOLLOW US FOR MORE ANALYSIS ☺

MATICUSDT LongMatic H1 chart, we see new strong bullish OrderBlock . Target price is 0.7160 level. Bulls can reach this level easily, so we can find some good entry here.

Will MATIC reach $1 above in coming months?MATIC is struggling to break out from $0.60s and $0.70s due to low volume and short liquidation leverage.
If a breakout from $0.75 (resistance) can expect to reach $1.20

Reminder on MATICUSDThe large triangle is forming similar to the one prior to the 2021 breakout
I expect MATICUSD to melt faces post this triangle breakout
I have posted a chart like this before but it becomes more relevant everyday
BULLISH

MATIC/USDT Ready For a Bullish Reversal the Key Support💎#MATICUSDT is navigating an ascending channel and is currently poised to retest the channel's lower support. We anticipate that the support at $0.674 will hold and set the stage for a bullish reversal that could reach the channel's upper resistance.
💎However, if #Polygon fails to maintain the $0.674 support and breaks below, this could signal an extended downward trend. The subsequent critical demand zone at $0.630 is vital to watch, known for its strong liquidity and history of catalyzing significant upward movements.
💎On the other side, if CRYPTOCAP:MATIC revisits this demand zone, securing a strong rebound is essential to sustain support. Failure to rebound could intensify bearish momentum, worsening market sentiment, and potentially leading to further price declines.
💎Stay alert and ready to adapt, Paradisers. Your ParadiseTeam is vigilantly monitoring and prepared to guide you through the volatile dynamics of the #MATIC market.
MyCryptoParadise
iFeel the success
