Matic

$MATIC Longer Term AnalysisHere is the next project in my long term buy list: MATIC. I will be adding more MATIC on the dips to my buy zones shown on the chart: 0.7234 and below.
Here are some key facts about the MATIC coin and the Polygon ecosystem:
High Scalability Solution: Polygon provides a scaling solution for Ethereum, one of the biggest challenges in the blockchain space. It enhances transaction speeds and reduces costs significantly, making blockchain technology more practical for everyday use.
Ethereum Compatibility: Despite being a scalability solution, Polygon remains inherently compatible with Ethereum. This compatibility means that developers can easily port their existing Ethereum DApps onto Polygon without significant changes, benefiting from higher performance and lower costs.
Robust Layer 2 Network: Polygon operates as a Layer 2 network, sitting atop the Ethereum blockchain. This layer provides additional structure to process transactions off the main Ethereum chain (Layer 1), ensuring faster and more efficient transaction processing.
Support for Multiple Scaling Solutions: Polygon is not limited to a single scaling technique; it supports a variety of approaches like Plasma, zkRollups, and Optimistic Rollups. This versatility allows it to cater to different needs and use cases in the blockchain ecosystem.
Growing Ecosystem of DApps: Polygon has a rapidly growing ecosystem of decentralized applications (DApps). This range includes everything from DeFi and NFT platforms to gaming and social applications, showcasing the network's versatility and developer-friendly nature.
Decentralized Governance: Polygon employs a decentralized governance model, involving MATIC token holders in decision-making processes. This democratic approach ensures that the network evolves in alignment with the community's needs and interests.
Energy Efficiency: Compared to traditional Proof of Work (PoW) networks, Polygon's Proof of Stake (PoS) consensus mechanism is more energy-efficient, addressing environmental concerns associated with blockchain technology.
Global Adoption and Partnerships: Polygon has seen widespread adoption and has formed numerous partnerships across various industries. These collaborations span from DeFi to entertainment, indicating its broad appeal and utility.
Strong Developer Support and Tools: Polygon offers robust support and tools for developers, including easy-to-use SDKs, APIs, and frameworks. This support fosters innovation and simplifies the development of blockchain-based applications.
Commitment to Continuous Improvement: The Polygon team is committed to continuous improvement and innovation, actively working to introduce new features and enhancements that address the evolving needs of the blockchain community.
MATIC and the Polygon network stand out for their innovative approach to blockchain scalability, compatibility with Ethereum, and a strong commitment to fostering a diverse and thriving ecosystem, making them pivotal players in the blockchain and cryptocurrency space.

Matic Network💥Hello friends! Have you heard about Matic?
💻 Matic Network, now known as Polygon, is a layer 2 scaling solution for Ethereum that aims to address the scalability and usability issues of the Ethereum blockchain. It enables faster and cheaper transactions by leveraging sidechains, plasma frameworks, and the Proof of Stake (PoS) consensus mechanism.
💡 The Matic Network coin (MATIC) is the native cryptocurrency of the Matic Network. It is used for various purposes within the network, including paying for transaction fees, participating in staking, and securing the network through consensus mechanisms.
🧰 Overall, Matic Network aims to improve the scalability, security, and user experience of decentralized applications (dApps) and Ethereum-based projects by providing a scalable and efficient platform for building and deploying them.
💰 now, I see a good opportunity for mid-term investment! It may have a decent price increase! You can find entry and take-profit levels on the chart!
Confess, which coins are currently in your portfolio? I would be happy to discuss a few of them, so write in the comments!📊
Thanks for Your attention🫶
Sincerely yours Kateryna💙💛

#Matic Elliot's ScenarioIn the daily and weekly time, it is moving in an upward channel for a while, and the current wave is the 5th wave of the 3rd wave. This larger cycle should not enter the range of 60 cents, in which case there will be an overlap and the analysis will be invalidated. But in the bigger time, which I will present after completing the current step, we will examine the possibility of a bigger super cycle that will also form a flag.

MATIC Long Opportunity 221%+ BreakoutCRYPTOCAP:MATIC is currently breaking out of a 3-year descending triangle pattern reversal, which is a bullish sign of continued upward movement. If the pattern is confirmed and plays out as expected, we can see a relatively swift 200%+ increase in Matic's price. 2.87 is my price target for this trade, which is just an under the ATH. However, I think this price target is low for Matic in the next 1-2 years. Although this pattern is looking to be confirmed, be careful with leverage and weigh your risk to reward carefully.
Polygon Matic is one of the best and most popular L2 tokens used as a scaling solution for Ethereum and is liked by old and new crypto investors. It's a "safe" bet on this bull market and a blue chip.
DYOR and bring home those gains!

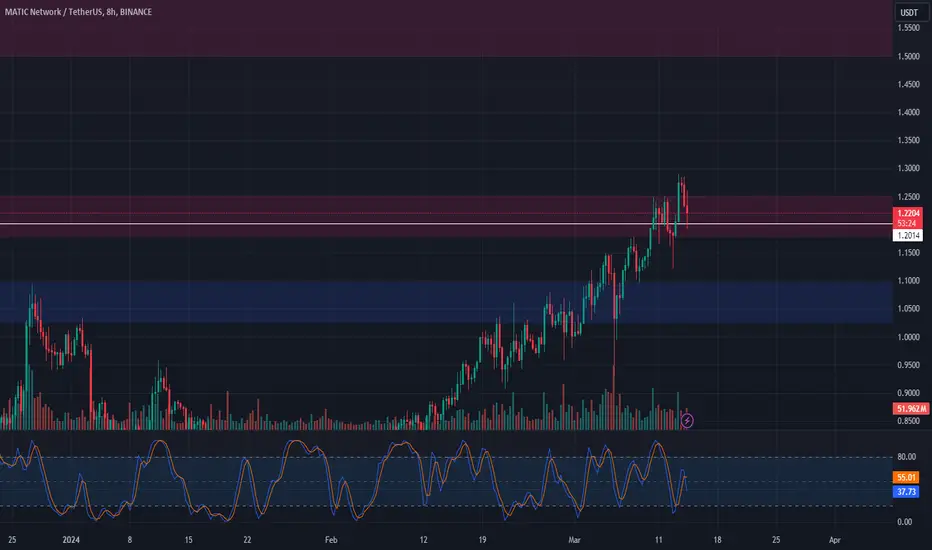
⚡ MATIC Trade Setup ⚡📊 Analysis:
Market Observation: Layer 2 coins, including MATIC, have shown notable performance recently.
Current Situation: MATIC is trading near resistance without a proper breakout.
Strategy: Plan for a long position upon a breakout above the upper resistance level.
Entry Point: Enter a long spot position when the price breaks above the upper resistance level at $1.25.
Take Profit: Target the next area of resistance between $1.50 - $1.60.
Stop Loss: Set a stop loss just below the breakout level, at around $1.20, to manage risk.
🌐 Note: Monitor the breakout closely and ensure it's supported by sufficient volume and confirmation before entering the trade. Adjust your strategy based on market conditions and price action.
#Matic - Do you like these Bull market targetsMatic is currently in an accelerative breakout move.
That we previously identified as having a great chance of triggering.
And should provide plenty of opportunity to profit from in this coming bull market.
@TheCryptoSniper
#HVF

MATICUSDT - Similar Break Out RSI PointsThe RSI on this Weekly chart for MATIC has poised itself nicely at the upper line
I expect it to reach way above like it did in the first instance, corresponding to a moonshot on chart

Polygon (MATICUSDT) Bull Run Begins: Price Could Soars up $2.20Polygon (MATICUSDT) has embarked on its next bull run after finding strong support at $0.93. Currently trading at $1.20, my prediction is a significant upswing that could take the price from its current level to $2.20 and further
This positive momentum follows a period of consolidation, where MATICUSDT found support and bounced back from its recent dip. The bulls appear to be in control, with the price steadily climbing higher.
Technical indicators are also flashing bullish signals, suggesting that the current uptrend has the potential to extend further.

MATIC - Sudden Up MovementI think price can move to 7.2 very quickly for MATIC
Price is poised to break out on the Monthly timeframe
Suggesting a move like this on chart which is just a copy of the first run which is the only one I can really use as comparison
The yellow indicator shows potential future tops for the coin
Very bullish stage in the market

Matic - Sleeping GiantMatic is breaking the symmetrical triangle on the weekly timeframe that held the price for approximately 2 years.
If the breakout is confirmed and continues to make higher lows, I see a huge upside potential with the possible bull market incoming.

MATIC SCALP📊Analysis by AhmadArz:
🔍Entry: 1.218
🛑Stop Loss: 1.242
🎯Take Profit: 1.194-1.167
🔗"Uncover new opportunities in the world of cryptocurrencies with AhmadArz.
💡Join us on TradingView and expand your investment knowledge with our five years of experience in financial markets."
🚀Please boost and💬 comment to share your thoughts with us!

Long MaticMatic looks to be breaking this larger and longer-term Cup and Handle neckline. Additionally, all of my proprietary blend of signals are flashing green rn. And finally, we have the bulk of our trading volume on the underside. Final target will be $1.75 with profit taking along the way. SL can be somewhere just below that descending blue TL, adjusting into time. RRR is 3/1 on this one.

MATIC... coming soonMATIC breakout from a so called " inversed head n shoulder" pattern formation. which resistance 0.90-1.00 turned support.
so far price re-test still able to supported well.
weekly closed bullish.
MACD momentum still strong.
next resistance 1.40 , 1.70

#MATIC/USDT LONG#MATIC
Since the beginning of the year, the price has been moving in a descending triangle.
The support was adopted on the lower border of the triangle.
Now the price is about to increase this model.
Price Now 0.8282
First Goal 1.222
Second goal 1.578
Representing 200% of the current price
You should pay attention to the rebound points.

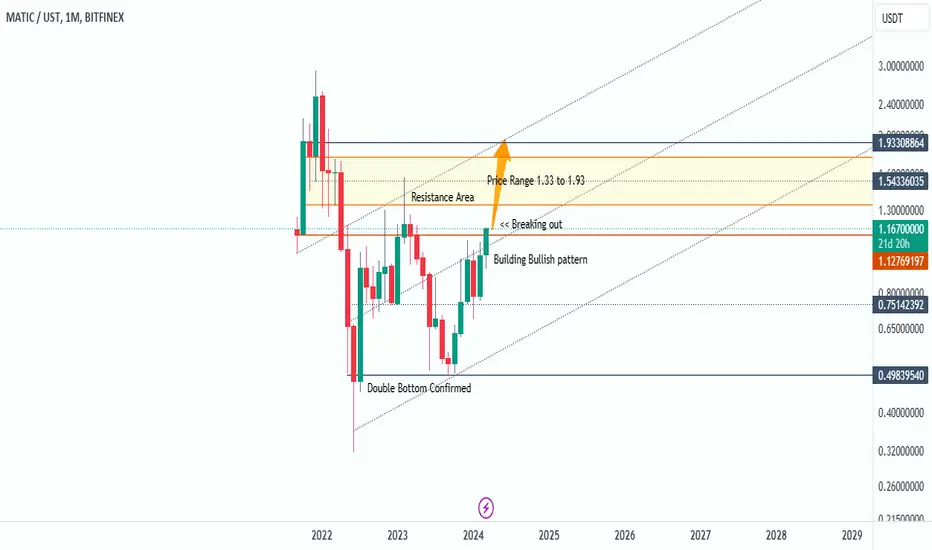
MATIC Price Bullish Breakout, Eyes $1.33-$1.50 ResistanceMATIC (MATICUSDT) is currently trading at $1.16 and appears to be on the verge of a bullish breakout. The token's immediate resistance level sits at $1.33-$1.50.
A successful breakout above this resistance zone could propel MATIC to a higher price range of $1.33-$1.93.
Note: Conduct own research before making any investment decisions.
MATICUSDT → Breaking through triangle resistanceBINANCE:MATICUSDT is forming an attempt to change the trend. The price is testing the resistance area of the descending triangle. A consolidation above the key level may start a strong distribution.
MATIC price is still in a bearish trend amid a strong cryptocurrency rally. For the last few days, the coin has been forming a resistance retest and is currently consolidating above 1.0303, a level that now plays a key role. If the bulls consolidate their positions above this level, they will form a potential for further growth of 20-50%. The first target is 1.1990, then 1.5490. On the weekly timeframe we see that the price realizes growth inside the range, the target of which is resistance.
Support levels: 1.03030, 0.9849.
Resistance levels: 1.1990, 1.5496.
The coin is breaking the resistance, but it is still under the pressure of sellers. If buyers consolidate their positions above 1.0303, form the so-called local bottom, strong growth awaits us in the medium and long term
BITSTAMP:BTCUSD CRYPTOCAP:TOTAL2 BINANCE:MATICUSD
Regards R. Linda!

MATIC/USDT A fantastic opportunity LONG trade!BINANCE:MATICUSDT The weekly chart has recently breached a significant resistance level, with the price now trading above it. This sets the stage for a promising long trade, with a potential target price ranging between USD 4 to 5.
#MATIC/USDT SPOT LONG ENTRY
Leverage: 1x
Entries: $1.1668
Take profit 1: $1.5055
Take profit 2: $2.5197
Take profit 3: $5.0244
Stop Loss: $0.7197
NOTE: This is just my prediction. Be sure to use STOPLOSS and remember that I am not a financial adviser. your money, your risk!
Thanks
The sroced.

#MATIC #MATICUSD #MATICUSDT #Polygon #Short #ShortSetup #Eddy#MATIC #MATICUSD #MATICUSDT #Polygon #Final #Update 'C' #Short #ShortSetup #Eddy
I'll Think Its Time to short Crypto ;-)
It's My New short setup on Polygon Matic <3
We are in the heavy supply order block range of the daily time frame, which is in the heart of the order block of the weekly time frame!
You also enter into sales short positions after checking the multi-time frame and getting the necessary approvals & at your own risk.
Related Analysis of Polygon Matic : (( MATIC/USDT )) : Check Link :
Polygon Matic Short Setup in #Update 'B' : (( MATIC/USDT )) : Check Link :
(( We got 19% profit in update 'B' ))

MATIC - Don't Miss the PARABOLIC ALTSEASON coming📉Hi Traders, Investors and Speculators of Charts📈
We're all looking for solid projects that have good fundamentals... and good upside. MATIC is one of those altcoins that haven't yet made a new ATH. Infact, it's not even close to its previous ATH with 190%+upside potential!
From a technical indicator perspective, we see a reliable "BUY" signal in the weekly timeframe:
From here, I expect altcoins to start making their rallies. Find more info on alt season 2024 here:
And if you need a little bit more technical info on how the rotation between BTC and altcoins work, check out this idea:
Cheers to another profitable day in crypto 🥳 And remember to realize gains🥂
_______________________
📢Follow us here on TradingView for daily updates📢
👍Hit like & Follow 👍
CryptoCheck
BINANCE:MATICUSDT

Alikze »» BTC | Next move scenariosAccording to the analysis presented in the weekly time frame, Bitcoin registered a new ATH and is currently facing selling pressure in the lower time frame. Three movement scenarios can be considered for the next movements of Bitcoin.
🔰 The first scenario : if it is not able to break this ceiling in the weekly or daily time, it can continue its growth with a pullback to Fibo 0.78, the range of $50,000 and confirmation of the return to Fibo 1.618 and the next supply area.
🔰 The second scenario : with the failure of the current area, it will grow up to the Fibo 1.618 range of $75,000 and continue its growth with a pullback to the previous major ceiling until the supply area.
🔰 Third scenario : if it enters the correction phase and if it breaks the 0.78 fibo, this correction will continue and probably touch the 1.272 fibo of the previous wave.
»»»«««»»»«««»»»«««
Please support this idea with a LIKE and COMMENT if you find it useful and Click "Follow" on our profile if you'd like these trade ideas delivered straight to your email in the future.
Thanks for your continued support.
Sincerely.❤️

MATICUSDTHi guys
It seems that the two entry points that we specified are low risk for entering the sale transaction.
But there is a possibility that the downward trend will start from this area.
What do you think?

MATIC/USDT planning upward journey what's in your mind?💎 Paradisers, get set for a promising opportunity with #MATICUSDT as it faces a setback from the supply zone, suggesting a strong chance for a bullish rebound from the demand level.
💎 Historically, we've seen supply transform into demand, propelling the price upward. Currently, #Matic surpassing robust supply zone $1.0535 a strong chance for a bullish pivot from the current demand level. The asset's robust position above the ema55 is signaling a potential uptick.
💎 On the flip side, should the $POLYGON dip below the $1.0535 demand level, we could see a shift towards a bearish trend it time to revise strategy a bullish rebound expected from lower demand $0.8318 droping below casue donward.
