Matic zones based on previous BTC ideahi guys, Matic has always been a great investment even when other coins in the market are not healthy.
but this time, please decide wisely as some major drops are also possible.
support zones are shown in the chart. the blue line is the pivot. All my bearish idea will be expired if the price goes above the pivot.
leave out your opinion in the comment section below
Maticlong

MATIC and QUANT - MATIC has more left Comparing MATIC and QUANT structures
As you can see they are extremely similar
Although QUANT in yellow is slightly ahead of MATIC (by 80%)
I expect MATIC to follow QUANT's lead and rise 80% further to where QUANT has topped out right now
Double bottom on the side pattern

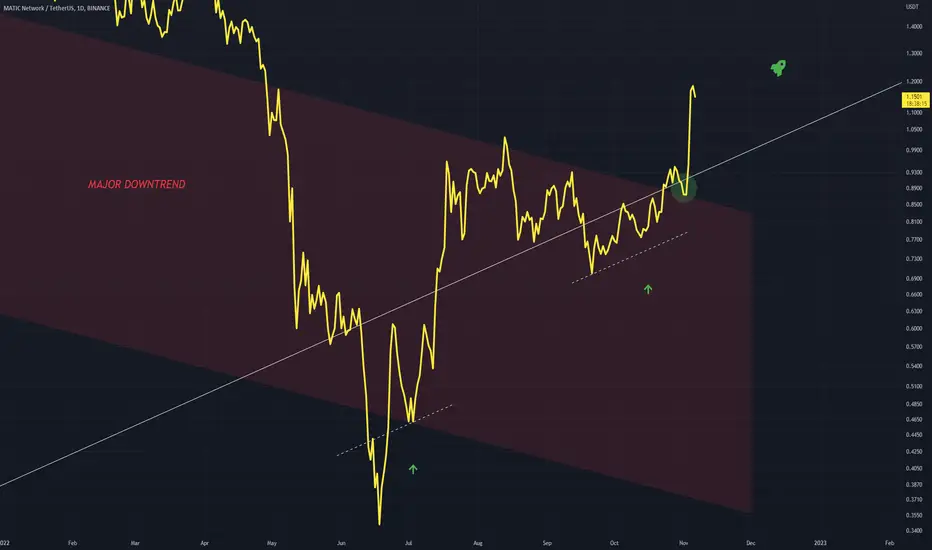
MATICUSD - Major Breakout / ThoughtsMATIC has broken out spectacularly out of a major downtrend in red
This is leading to a new bull cycle that coincides well with a bottom for BTCUSD
MATIC in my eyes is a good choice as recent developments surrounding the NFT area and Reddit is a bull signal
Green circle is the breakout point
MATIC/USDT - LONG -- Support me with numbers and follow up on my account for other deals in the future. Thank you for coming to this part.
---------------------------------------------------------
⚡️⚡️ MATIC/USDT ⚡️⚡️
Exchange: Binance Futures
Trade Type: Breakout (Long)
Leverage: Cross (1.0X)
Entry Orders:
1) 0.9664 - 100.0%
Take-Profit Orders:
1) 1.0089 - 20.0%
2) 1.0575 - 20.0%
3) 1.0993 - 20.0%
4) 1.1519 - 20.0%
5) 1.2666 - 20.0%
Stop-loss Orders:
1) 0.8964 - 100.0%
Trailing Configuration:
Take-Profit: Percentage (4.0%)
Stop: Breakeven -
Trigger: Target (1)

MATIC :: Major Support/Resistance Zones :: 1DHere are the major support and resistance zones for MATIC/USDT on the daily time frame.

MATICanalysis was shared few days ago
moving as expected 36% profit so far hold it tightly still longway to go

MATIC was rejected from the Weekly Resistance What's Next?MATIC was rejected from $1.014 weekly resistance and has been dumping/going sideways since tapping this zone.
However, 4 hour RSI now looks like MATIC is oversold and it will be important to keep eyes at the daily support area for buying some bags.
The daily support for MATIC is at $0.7873 - $0.6892. If we lose $0.6892 we can expect a bearish momentum towards the lower channel which will be a bloodbath.
Next few days for MATIC are very important I believe MATIC's support will hold & we can expect a pump if market starts bouncing.
All the important levels are marked on the chart.
Enjoy Trading.
(press like 👍 if you enjoy + comment your opinion about the market or your thoughts, below this analysis)

MATIC ANALYSIS#MATIC UPDATE.
#MATIC is currently trading in a rising channel and ascending triangle as well.For upside move MATIC has to close above the blue box resitance area on 4H ,however break below the rising channel would lead into dump so keep eyes on matic.

MATIC - Buying SignalBYBIT:MATICUSDT.P
4H time frame
-
MATIC broke the decending channel before, and it is retesting this channel currently.
Support will easily form after resistance is broken, so we can open long here.
-
Entry: 8.37
Add: 8.15
TP: 0.9, 0.975, 1.035
SL: 0.77

Matic(Polygon)At the moment there is not enough demand in the market to break through the resistance that we see locally.
It is possible that the local highs will be broken.
If you like the idea, give it a "Like". That's the best "Thanks!" for the author 😊
P.S. Always do your own analysis before a trade. Put a stop loss. Fix profits in installments. Withdraw profits in fiat and make yourself and your loved ones happy.
Translated with www.DeepL.com (free version)
MATIC - Double BottomA bullflag breakdown into a double bottom is evident in early price evolution
This seems to be happening again with a bullflag being present, all that's needed now is a small breakdown and from there it is lift off as per the bullish double bottom pattern
Daily Chart
Posting some of my previous MATIC analyses

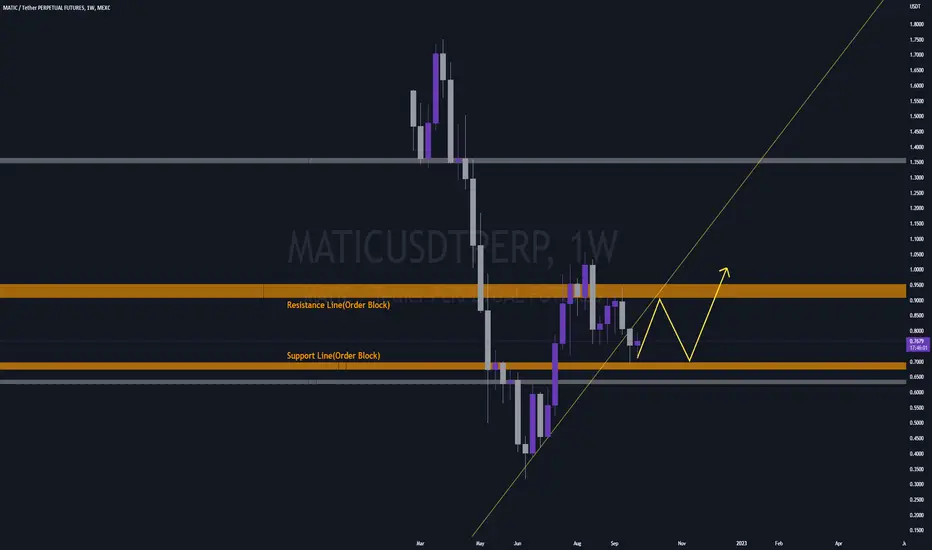
MATICUSDT 1W LONG ANALYSISIt is expected that it will eventually rise after crossing between important orange order blocks.
Price predictions for MATIC. Are you Bullish on Polygon?My primary expectation for Matic is one more low in a wave five of the wave c. However it has done a lower low so we could technically go up up from here and nearly hit the 50% fib which is an ideal retracement for a lager wave 2. If we are in the wave 4 still before wave down in the wave C. We could comedown between 0.6867 all the way down to 0.4587 in a wave 2. If we come down any further I will be laddering buy orders down to 0.45 cent. Just remember it reversing in this area is not guaranteed but I think its very likely. If we do reverse to the upside the wave 3 targets would be 1.41 to 1.86 which is 90 to 150% from where we are now. :)

MATIC Extended V Bottom 1WStarting with a clean chart...
A look at the weekly shows an extended V bottom, the V bottom is often seen as a recovery formation. Should the price fall below $0.52 I consider the formation eliminated. With the "extended" V bottom, the sideways (extended) consolidation phase serves as a pause and often resembles the shape of a channel or bull flag.
I zoom in on the daily timeframe and also notice there in the tip of the V shape also a Smaller version of this Extended V Bottom Formation. On this timeframe we also find the zones where I expect possible resistance/support. And the Flip zone is an important one. Here the bulls need to claim the zone in order to stomp through.
Also note that the MA50 and MA200 are already approaching each other and if they cross bullish, its gonna be an Golden Cross where the Death cross took place in early March and the previous Golden Cross in early January 2021. Or in other words that moment could be a bullish moment.
On the 4 hours I mark the price by means of a Descending Scallop and in the background I have also drawn the Descending broadening wedge where the resistance line has been tested as a support line. in case of a breakout on the formation and a re-test, the price targets are mentioned. Also be sure to keep the big picture in mind there is still plenty of room towards the $0.23 mark.
Keep calm, Do your own research! trade safe and manage your risk.
(Disclaimer: This is not financial advice)

MATICUSDT - Symmetrical Triangle Pattern!MATICUSDT (4h Chart) Technical analysis
MATICUSDT (4h Chart) Currently trading at $0.93
Buy level: Above $0.92
Stop loss: Below $0.785
Target 1: $0.983
Target 2: $1.15
Target 3: $1.45
Target 4: $1.75
Max Leverage 3x
Always keep Stop loss
Follow Our Tradingview Account for More Technical Analysis Updates, | Like, Share and Comment Your thoughts

MATIC: Great prospectsThe situation is excellent for MATIC.
Earlier, the impulse was formed, the structure of the waves of which is easy to identify.
At the moment some ABC correction is formed, in which wave C may be completed very soon.
I will open a long position on the completion of the intermediate wave C (within ABC zigzag), in order to make profit for a large wave 3 or C.

MATICUSDT: Setups for Long & ShortOnce again, I made a more detailed recount of wave levels for MATIC.
Apparently the impulse structure in the big wave 1 or A has already ended, and now the correction in the big wave 2 or B continues.
I considered the coin earlier to open a short position, but I decided not to rush and wait for the first signs for the price reversal. I am not sure yet that the correction in wave B (in wave 2 or B) has ended.
Anyway, even if fail to open a short position (due to the ambiguity of the situation), I already expect the price to reach the internal support levels where I will be open a long position.

Matic Double Bottom Pattern D1BINANCE:MATICUSDT
✅Before we start to discuss, I would be glad if you share your opinion on this post's comment section and hit the like button if you enjoyed it.
Thank you.
Possible Targets
➡️Fib still relevant on D1 with perfect double top and fake out. Downtrend line broke and now Matic should test local but main psychological price zone 1$ (red block)
➡️Matic I think will find strong sells at this level and going to test once again strong buyers zone (green block) and form on D1 double bottom.
➡️After double bottom the road will be exactly to 0.618 Level by Fib around 1.70$
➡️ Timing big pattern probably will be finish by end of October beginning of November
Hope you enjoyed the content I created, You can support with your likes and comments this idea so more people can watch!
✅Disclaimer: Please be aware of the risks involved in trading. This idea was made for educational purposes only not for financial Investment Purposes.
* Look at my ideas about interesting altcoins in the related section down below ↓
* For more ideas please hit "Like" and "Follow"!

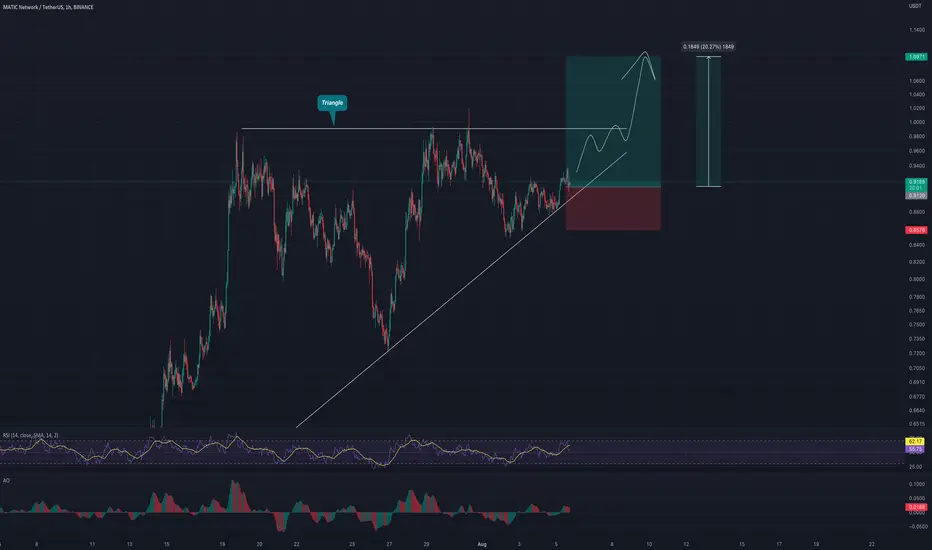
MATIC will fly to the moon? ForecastMATIC has drawn a "Triangle" pattern, the price is moving in it, I think we will break it up soon!
Subscribe and stay tuned for new ideas. Every day I post 10 profitable ideas a day.
MATICUSDT: Bullish rally will continueI'm sharing with you another great trading plan for medium-term position holding and local trade planning for MATIC coin.
In the medium term, the correction in the form of ABC pattern (in wave B) is probably completed.
At the moment the impulse structure of wave 1 is already forming within the big C wave.
Locally, the price took a timeout for the correction in wave 4, after which we should expect the continuation of growth in the framework of wave 5 (in wave 1).
It is possible to try to win back the local decrease by opening a short position at the first signs of price reversal to start the decrease in the framework of wave C (in wave 4).
Opening a long position is relevant on the border of the main ascending channel and the trend line.

#MATIC/USDT 30M UPDATE !!Hello dear traders, we here new so we ask you to support our ideas with your LIKE and COMMENT, also be free to ask any question in the comments, and we will try to answer for all, thank you, guys.
As we can see from the above-mentioned chart that MATIC/USDT was trading inside the falling wedge channel and broke above.
Currently, it's moving downside to retest the upper trend line which is the buying zone for the matic to earn a good amount of profit in upcoming hours.
So we can take entry at the
#MATIC/USDT LONG TRADE SETUP
ENTEY:-CMP and $0.8830
TARGET:-20%
STOP LOSS:-$0.8700
WITH LAVERAGE:-10x to 20x
Remember:-This is not a piece of financial advice. All investment made by me is at my own risk and I am held responsible for my own profit and losses. So, do your own research before investing in this trade.
Thanks for your time, we hope our work is good for you, and you are satisfied, we wish you a good day and big profits.
THANK YOU.

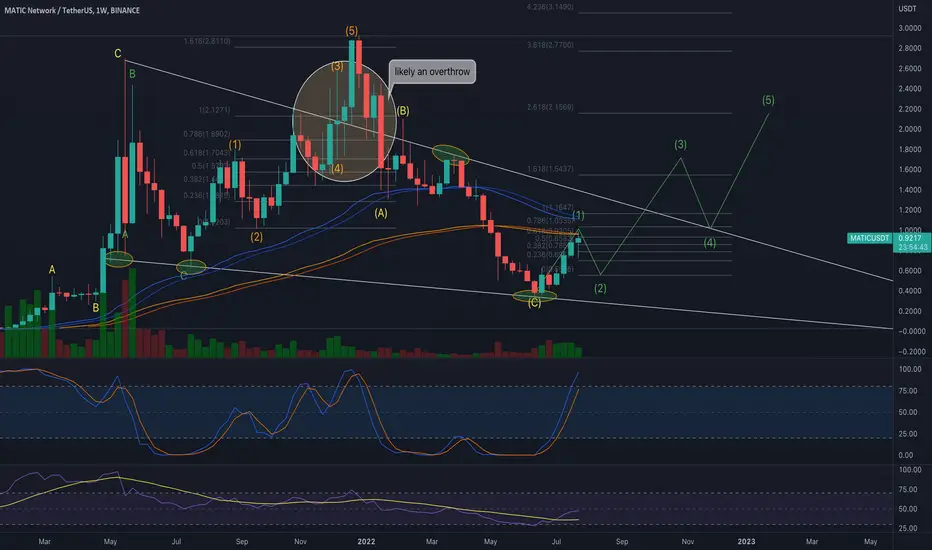
MATICMatic seems to be done with the W1.
If the c wave bottom is in as my chart suggests then we are coming back into W2 now or after $1.17 tests.
The W2 can finish around .55c-.62c to retest B wave of the 1 shown off the lows of the triangle.
Either way this move looks exhausted.
If the C wave is not finished and this move up was the 4th of the 5 down for the C wave Flat correction from the 2021 highs then to that point MATIC will likely test .23c and finally bottom.
Only time can tell but I lean towards this chart projection.