MATICUSD ❕ volatility decreasesTrading volumes indicate the market's interest in price growth.
Matic is trading above liquidity.
Price has broken up 50EMA and 200EMA (4H TF)
RSI chart is in the buy zone (4H, 1H and 30m TFs)
The asset has fixed above 50EMA (30m TF)
I expect MATIC to rise if the asset can fix above the liquidity zone.
Maticusd

✅TS ❕ MATICUSD: is moving✅✅ MATIC is moving in the area of the resistance level.
It is possible to update the maximums.
Then the fall.✅
🚀 SELL scenario : short to 0.86.🚀
----------------------------------------------------------------------------
Remember, there is no place for luck in trading - only strategy!
Thanks for the likes and comments.

MATIC 4H ANALYSIS Matic very well project.
Resistance $0.90 ,0.95,$1
Support $0.85
Matic trying $1 Breakout.
Matic Long Term Vision $5
Matic

✅TS ❕ MATICUSD: bounced down✅✅ MATIC bounced down.
The price has reached support.
Correction is possible.✅
🚀 BUY scenario : long to 0.9557.🚀
----------------------------------------------------------------------------
Remember, there is no place for luck in trading - only strategy!
Thanks for the likes and comments.

Can MATIC be supported on the HA-High line...Hello?
Traders, welcome.
If you "Follow", you can always get new information quickly.
Please also click "Boost".
Have a good day.
-------------------------------------
(MATICBTC 1W chart)
If the price holds above 0.0000 5049, it is likely to explode the upside force.
---------------------------------------
(MATICUSDT 1W chart)
On the MATICBTC chart the price is in the high range, but on the MATICUSDT chart this is not the case.
This phenomenon is caused by the price fluctuation of USDT following the fluctuation of BTC price.
Therefore, the charts we usually see and trade are the MATICUSDT or MATICKRW charts.
However, I think the MATICBTC chart serves the same purpose as a dominance chart or an index chart, showing the strength of MATIC when the BTC price starts to show an upward trend.
Therefore, even if the price on the MATICUSDT or MATICKRW chart declines, if the MATICBTC chart maintains the price, eventually MATIC will show an increase in price.
In this sense, looking at the MATICUSDT chart, it can be interpreted that if the price is maintained in the 0.6164-0.8191 range or higher, it is likely to show an uptrend.
So, if it goes up, I expect it to touch around 1.2246.
(1D chart)
The question is whether the price can hold above 0.8647 and rise above 0.9486
-------------------------------------------------- -------------------------------------------
** All descriptions are for reference only and do not guarantee profit or loss in investment.
** If you share this chart, you can use the indicators normally.
** The MRHAB-T indicator includes indicators that indicate points of support and resistance.
** HA SRRC indicators are displayed as StochRSI (line), RSI (columns), and CCI (bgcolor).
** The CCI indicator is displayed in the overbought section (CCI > +100) and oversold section (CCI < -100).
(Short-term Stop Loss can be said to be a point where profit or loss can be preserved or additional entry can be made by split trading. This is a short-term investment perspective.)
---------------------------------

MATICUSD ❕ under the liquidityMATIC is trading under liquidity.
TD Sequential has formed a reversal signal downwards (4H TF)
If the asset breaks through the down range, I expect the price to decline.

MATICUSD Non-Log Trend Line Drawing a trend line between two strong flag like structures
The first prior one popped off greatly, will we see something like this for the second flag structure?
Post to support my prior Analysis that got a few views the other day

MATICUSD Repost (It Reminds Me) MATIC Definitely reminds me of an early Ethereum in many ways
This chart furthers that
Structure with labels 1,2,3 can be seen in early ETH chart
This structure is current on MATICUSD
Will we catch a 13000% move on MATICUSD? As was seen on ETH?

MATIC is in danger, it will DUMP hard!Hello, everyone!
Let’s continue to analyze the most dangerous altcoins which showed the greed during the bounce on the Bitcoin. Today it’s MATIC time. It now has the most dump potential. I suppose that the market maker created the fake growth on this altcoin to show other traders the illusion of the asset’s power. Of course it’s fake and MATIC is going to break or at least test it’s bottom at $0.33 and I will show you why. Let’s go!
Let’s take a look at the 1D time frame of the MATICUSDT of the WhiteBit exchange. The bottom at $0.33 was the end of the wave 3 as on the entire crypto market. The corrective wave 4 retraced this wave with the zigzag correction. Zigzag correction usually consists of wave A (5 waves), wave B (3 waves) and wave C(5 waves). You can see on the chart how perfectly the market structure for MATIC corresponds to this theory. One question you can have is why the wave 5 did not break the wave 3 top in the wave C. I can explain it because wave 5 could be trimmed. It’s OK for the altcoins.
Now the price is drawing the wave 5 and I suppose the the sub wave 3 of this wave is in progress. The minimal target for the wave 3 is the $0.61 – 1 Fibonacci extension level, but I think MATIC will hit $0.3 again because the 1.61 Fibonacci placed right here.
Best regards, Ivan
_______________________________________________________________________
Guys, if you like my analytics, please support me with your boosts and comments!

✅TS ❕ MATICUSD: triple vertex✅✅ MATIC has formed a triple vertex.
The price is moving around the resistance level.
A fall is possible.✅
🚀 SELL scenario : short to 0.86.🚀
----------------------------------------------------------------------------
Remember, there is no place for luck in trading - only strategy!
Thanks for the likes and comments.

Matic Possible Short OpportunityHi, there is a short trade possibility here for Matic ,
Matic suffers from low volume at this level
And there is a good Bearish RSI divergence too,
That it might suggest downside momentum from here.
Watch out for PMI and DXY reaction to it at this critical price .
*Do your own research and this is not a financial advice*

MATIC BUY SETUPhi guys.
i have a idea for matic . i think From the green area, we can go up . Our trigger line is broken.

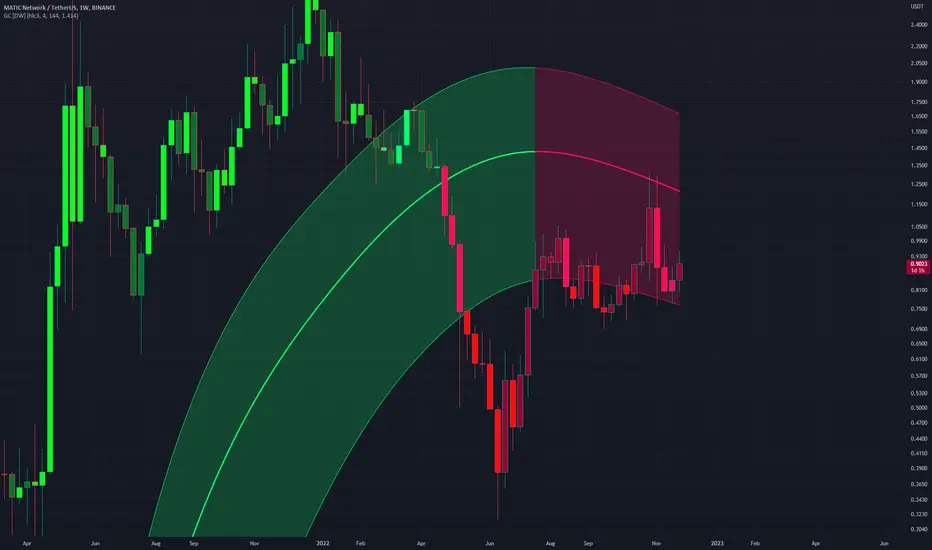
MATICUSD - Contained Within Channel MATICUSD on a Weekly timeframe
Price has moved up within the Gaussian Channel
Price will likely led to a breakout to the upside as this containment within channel continues and is seen as support
This can be seen as a bullflag on the Monthly, which I have linked below
MATIC Double Bottom StructureDouble bottom will complete the structure.
It will be a great buying opportunity if this happens.
Good Luck and let's see what time brings.

Maticusdt Look at matic with
chart pattern
Weekly chart and wedge pattern
---------------------------------
This analysis is just my mental and personal idea
Please analyze before entering
Get approval first


Trading opportunity for MATICUSDTBased on technical factors there is a Buy position in :
📊 MATICUSDT
🔵 Buy Now 0.924
🧯 Stop loss 0.825
🏹 Target 1 1.067
🏹 Target 2 1.275
🏹 Target 3 1.530
💸RISK : 1%
We hope it is profitable for you ❤️
Please support our activity with your likes👍 and comments📝

MATICUSD ❕ hidden bearish divergenceTrading volumes are down and the asset is no longer actively bought in the range.
The price is under liquidity.
TD Sequential has formed a reversal signal downwards (1H TF)
I expect the price to fall after the price fixes in the range.

✅TS ❕ MATICUSD: bounced back✅✅ MATIC bounced back from the support.
The main trend is downward.
So be careful.✅
🚀 BUY scenario : short to 0.955.🚀
----------------------------------------------------------------------------
Remember, there is no place for luck in trading - only strategy!
Thanks for the likes and comments.

Potential DeFi Bearflag Testing 88.6% Retrace as ResistanceI'm currently not so optimistic about DeFi products and believe that it will be the weakest sector in the crypto market so I have been taking and looking for bearish trades within the DeFi Market and Matic, along with ETH right now appears to be in a position where they could crash and lose a lot of their respective values.

Polygon MATIC price Medium and Long term tradeThe MaticUSDT price was one of the first to break out of the falling trend channel back in July this year.
Now MaticUSD is trading above the liquidity zone of $0.67 - 0.77
You can try a medium-term trade:
Entry $0.831
Stop $0.7624 (-8%)
Take profit $1.1974 (+44%)
Profit/loss ratio 5/1
You can also consider this trade as a long-term investment and hold it until the take profit of $1.90 (+127%)
You can also keep a larger stop on the position, around $0.67
There are many options, it depends on what parameters your risk and money management allows .
But it is probably not worth getting the Polygon token - Matic when the price will be below $0.67 . After all, there is an "emptiness" below the liquidity zone and the possibility of the MaticUSDT price collapsing to around $0.4
_____________________
Did you like our analysis? Leave a comment, like, and follow to get more

Matic zones based on previous BTC ideahi guys, Matic has always been a great investment even when other coins in the market are not healthy.
but this time, please decide wisely as some major drops are also possible.
support zones are shown in the chart. the blue line is the pivot. All my bearish idea will be expired if the price goes above the pivot.
leave out your opinion in the comment section below

Matic - Good Opportunity
MATICUSDT :
is on a Good opportunity for sell or buy.
but in my opinion , long side have better chance.
if price can break YELLOW area and hold , you can enter to a good long position.
if price can break RED area and hold , you can enter to a good long position.
Keep an eye on it.
