Swipe the Polygon Vault MATIC/USDT Bullish Heist Strategy🔥 MATIC/USDT Heist Plan: Swipe the Loot Before the Cops Clock In! 🏴☠️💸
🌍 Oi! Hola! Bonjour! Hallo! Marhaba!
💼 Welcome back, Money Makers & Market Bandits!
The Polygon (MATIC) vs Tether vault is wide open! Based on our 🔍 Thief Trading Style Analysis, it's time to plan the ultimate crypto chart robbery with a long-side assault on this bullish breakout. 📈💥
💣 Robbery Blueprint – The MATIC/USDT Master Plan
🚪 ENTRY STRATEGY: Get In, Get Rich, Get Out!
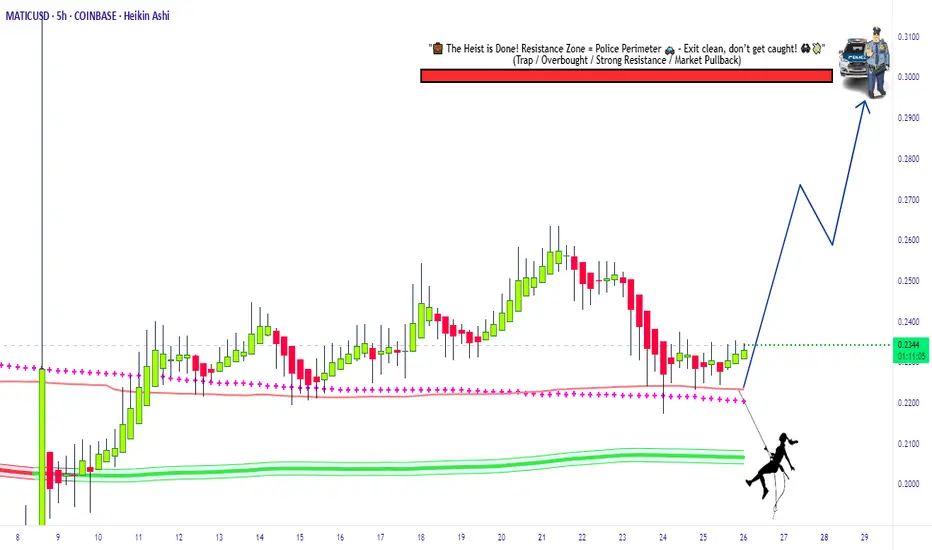
⚡ Vault Breach: Enter LONG at market price if you're bold & fast.
🎯 Smart Entry: Wait for price pullbacks on 15m/30m swing lows/highs.
💎 Use layered DCA-style orders for clean risk-controlled entries.
Thieves don’t rush—they snipe the perfect price levels.
🛑 ESCAPE PLAN: Stop Loss Strategy
📍 SL placed at: 0.2000 (based on 4H candle wick zone).
💡 Adjust SL to your loot capacity (risk, lot size, number of orders).
⚠️ If price dips near SL, that’s the cops knocking—bail fast or go down swingin’.
🎯 TARGETS: Stack Your Bags Before the Alarm Rings
🚀 Primary Target: 0.3000
🧲 Scalpers: Grab & Go! Stick to long bias only. Use trailing SL to protect the gains.
🎩 Swing Robbers: Hold strong. Watch for resistance traps & trailing stops near key zones.
📊 Market Intel: Why This Heist Has High Odds 🎯
🔋 Bullish pressure building with growing momentum.
📡 Supporting Data:
🔍 On-chain metrics signaling accumulation
💼 Macro sentiment favoring risk assets
🧠 COT reports + intermarket analysis leaning bullish
Just don’t get comfy—this is a heist, not a honeymoon!
🚨 Trade Warning – Don’t Get Caught!
📢 Major News Releases = High Volatility.
🚫 Avoid fresh trades during key announcements.
🔒 Use trailing SL to lock in profits & escape clean.
💥 Like, Follow & Power Up the Robbery Squad 💥
💬 Support the crew. Hit BOOST to keep these trade ideas flying.
Your thumbs-up fuels the next chart breach. 💪
📡 Stay locked in—more heist setups coming soon!
🎯 Trade Sharp. Swipe Smart. Escape Fast. 🏴☠️
Thief Trader Out. 🐱👤💰
MATICUSDT
nice buy opportunity for matic (polygan)we are facing the great support area around 0.21 if the paterns close at 0.23 by the end of the week we are going to have nice 30% rise

NEARUSDT UPDATE
Pattern: Descending Triangle Breakout
Current Price: \$2.937
Target Price: \$3.60
Target % Gain: 22.69%
Technical Analysis: NEAR has broken out of a descending triangle on the 8H chart. Price is closing above resistance with decent momentum, indicating a potential move toward \$3.60.
Time Frame: 8H

XRPUSDT UPDATE
Pattern: Falling Wedge Breakout
Current Price: \$2.5398
Target Price: \$3.90
Target % Gain: 55.29%
Technical Analysis: XRP has broken out of a falling wedge on the 1D chart with strong bullish momentum. The breakout is confirmed with a daily close above resistance and increased volume.
Time Frame: 1D
Risk Management Tip: Always use proper risk management.

MATICUSD - Resistance Flipped SupportSupport has been found along the 200MA on this 4HR chart
This line has previously been seen as an area of strong resistance but now its showing signs of support
This is a sign of further movement up on this 4Hr timeframe

DEXEUSDT UPDATE
Pattern: Bullish Pennant Pattern
Current Price: $14.835
Target Price: $26.61
Target % Gain: 80.18%
Technical Analysis: DEXE has broken out of a descending triangle pattern on the 1D chart. The breakout is supported by a strong bullish candle and sustained price action above the trendline resistance, indicating momentum toward the target.
Time Frame: 1D
Risk Management Tip: Always use proper risk management.

ACEUSDT UPDATEACE/USDT Technical Setup
Pattern: Falling Wedge Breakout
Current Price: $0.635
Target Price: $1.714
Target % Gain: 250.34%
Technical Analysis: ACE has broken out of a long-term falling wedge pattern on the 1D chart with strong bullish momentum. Volume has increased significantly, confirming the breakout with potential for a 250% upside move.
Time Frame: 1D
Risk Management Tip: Always use proper risk management.

FIDAUSDT UPDATEFIDAUSDT is a cryptocurrency trading at $0.1094. Its target price is $0.2400, indicating a potential 100%+ gain. The pattern is a Bullish Falling Wedge, a reversal pattern signaling a trend change. This pattern suggests the downward trend may be ending. A breakout from the wedge could lead to a strong upward move. The Bullish Falling Wedge is a positive signal, indicating a potential price surge. Investors are optimistic about FIDAUSDT's future performance. The current price may be a buying opportunity. Reaching the target price would result in significant returns. FIDAUSDT is poised for a potential breakout and substantial gains.

DGBUSDT UPDATEDGBUSDT is a cryptocurrency trading at $0.00926. Its target price is $0.01500, indicating a potential 70%+ gain. The pattern is a Bullish Falling Wedge, a reversal pattern signaling a trend change. This pattern suggests the downward trend may be ending. A breakout from the wedge could lead to a strong upward move. The Bullish Falling Wedge is a positive signal, indicating a potential price surge. Investors are optimistic about DGBUSDT's future performance. The current price may be a buying opportunity. Reaching the target price would result in significant returns. DGBUSDT is poised for a potential breakout and substantial gains.

LAYERUSDT UPDATELAYERUSDT is a cryptocurrency trading at $0.7311. Its target price is $1.3000, indicating a potential 85%+ gain. The pattern is a Bullish Pennant, a continuation pattern signaling a trend continuation. This pattern suggests a brief consolidation before a strong upward move. A breakout from the pennant could lead to a significant price surge. The Bullish Pennant is a positive signal, indicating a potential trend continuation. Investors are optimistic about LAYERUSDT's future performance. The current price may be a buying opportunity. Reaching the target price would result in significant returns. LAYERUSDT is poised for a potential breakout and substantial gains.

OGNUSDT UPDATEOGNUSDT is a cryptocurrency trading at $0.0835. Its target price is $0.1200, indicating a potential 50%+ gain. The pattern is a Bullish Falling Wedge, a reversal pattern signaling a trend change. This pattern suggests the downward trend may be ending. A breakout from the wedge could lead to a strong upward move. The Bullish Falling Wedge is a positive signal, indicating a potential price surge. Investors are optimistic about OGNUSDT's future performance. The current price may be a buying opportunity. Reaching the target price would result in significant returns. OGNUSDT is poised for a potential breakout and substantial gains.

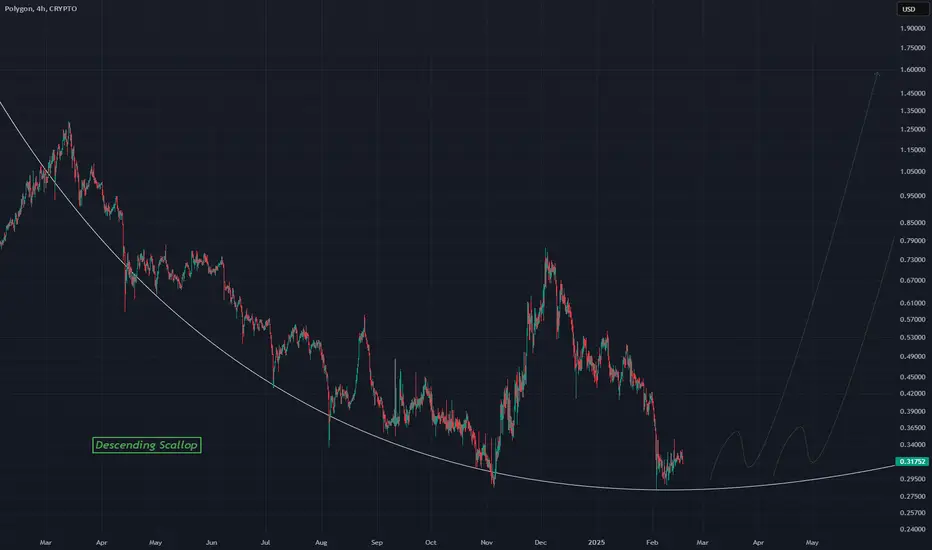
MATICUSD - Descending Scallop Reversal PatternA reversal pattern on this 4Hr chart for MATIC
MATIC has been beaten down hard and is due for a reversal and this pattern suggests it
Price slowly will flip towards the bulls favor and they will take control
The scallop pattern can be identified by a curve like this, this one being a descending one
Again the 4Hr chart
Hitting a bottom on MATIC?...I don't really trade Crypto's however this one stood out to me as a potential opportunity on the weekly time scale.
MATIC has been trending down since late 2021 but it has always shown a bounce around the $0.30 zone, ultimately creating a very large descending triangle coupled with a MACD that has been diverging up.
Could we see a rally ahead towards $1.00+? well that remains to be seen but I liked the setup and took the opportunity. Should be interesting in how this develops and thus, I'll be keeping an eye on this one.
I'm also checking out DOGE and XRP.
As always, Good Luck & Trade Safe.

MATIC returning to equilibrium would be a 128% gain from here!MATIC is looking extremely undervalued at current levels. The price has pulled back considerably since the "Trump election pump" and is forming a nice wedge on the 4-hour chart, which is currently on a four-count. A price move back to equilibrium from the wedge's bottom trendline would, by itself, result in approximately a 128% gain.
Longer term, if the price breaks out of the monthly chart wedge pattern (see comments below for the chart), which is also currently trading at a four-count, we could see some incredible price appreciation over the next 6 to 9 months.
Good luck, and always use a stop-loss!

MATICUSD Big Breakout Price within this triangle will lead to a large breakout
A triple bottom is the main cause for this bull situation
BULLISH LONG TERM
Matic$

VTHOUSDT UPDATEVTHOUSDT is a cryptocurrency trading at $0.002696. Its target price is $0.003800, indicating a potential 45%+ gain. The pattern is a Bullish Falling Wedge, a reversal pattern signaling a trend change. This pattern suggests the downward trend may be ending. A breakout from the wedge could lead to a strong upward move. The Bullish Falling Wedge is a positive signal, indicating a potential price surge. Investors are optimistic about VTHOUSDT's future performance. The current price may be a buying opportunity. Reaching the target price would result in significant returns. VTHOUSDT is poised for a potential breakout and substantial gains.

HBARUSDT UPDATEALGOUSDT is a cryptocurrency with a current price of $0.3900. Its target price is $0.5500, indicating a potential 50%+ gain. The pattern is a Bullish Pennant, a continuation pattern signaling a potential breakout. This pattern suggests a brief consolidation before a strong upward move. The Bullish Pennant is a positive signal, indicating a potential price surge. Investors are optimistic about ALGOUSDT's future performance. The current price may be a buying opportunity. Reaching the target price would result in significant returns. The Bullish Pennant pattern typically leads to a strong upward move. ALGOUSDT is poised for a potential breakout.

XRPUSDT UPDATEXRPUSDT is a cryptocurrency trading at $2.4840. Its target price is $3.1000, indicating a potential 25%+ gain. The pattern is a Bullish Pennant, a continuation pattern signaling a potential breakout. This pattern suggests a brief consolidation before a strong upward move. The Bullish Pennant is a positive signal, indicating a potential price surge. Investors are optimistic about XRPUSDT's future performance. The current price may be a buying opportunity. Reaching the target price would result in significant returns. The Bullish Pennant pattern typically leads to a strong upward move. XRPUSDT is poised for a potential breakout.

PHAUSDT UPDATEPHAUSDT is a cryptocurrency trading at $0.3209. Its target price is $0.5000, indicating a potential 50%+ gain. The pattern is a Bullish Falling Wedge, a reversal pattern signaling a potential trend change. This pattern suggests that the downward trend may be ending. A breakout from the wedge could lead to a strong upward move. The Bullish Falling Wedge is a positive signal, indicating a potential price surge. Investors are optimistic about PHAUSDT's future performance. The current price may be a buying opportunity. Reaching the target price would result in significant returns. This pattern typically leads to a strong upward move.

#MATIC/USDT Ready to go higher#MATIC
The price is moving in a descending channel on the 4-hour frame and sticking to it well
We have a bounce from the lower limit of the descending channel, this support is at a price of .4471
We have a downtrend on the RSI indicator that is about to be broken, which supports the rise
We have a trend to stabilize above the moving average 100
Entry price 0.5090
First target 0.5432
Second target 0.5815
Third target 0.6200

Bought timehello friends
Considering the sharp back and forth movement of this currency and hitting a higher ceiling, we expect that it will move to the specified targets now that the pullback has started.
Be successful and profitable.

Polygon (POL) AKA "MATIC" - Long Key LevelsPolygon (POL) or "MATIC" has experienced a strong rally recently, climbing from its monthly low of $0.40 to its current price of $0.70. This implosive move has brought the bulls to push POL to a critical descending trendline resistance level that the bears have held in a long-term downtrend since 2022.
The key level to watch is the $0.76 mark, where the neckline and trend line meet with previous resistance zones. A breakout above $0.76 could potentially surge POL to it's 1st target which is around a resistance level of: $0.89. If momentum continues, then price action will retest between: $1.23 - $1.48 representing a potential upside of +100% from the breakout at this current point

#MATIC/USDT#MATIC
The price has broken the descending channel on the 1-day frame upwards and is expected to continue
We have a trend to stabilize above the 100 moving average again
We have an upward trend on the RSI indicator that supports the rise by breaking it upwards
We have a support area at the lower limit of the channel at a price of 0.3400
Entry price 0.3900
First target 0.4917
Second target 0.5847
Third target 0.7193
