ARBUSDT IDEAUPDATE
Breaking Falling Wedge in 12H TF.
Successful break out can initiate 35-40% Bullish move !!!
COIN DETAILS
Market capitalization of Arbitrum (ARB) is $2,315,364,171 and is ranked #41 on CoinGecko today. Market cap is measured by multiplying token price with the circulating supply of ARB tokens (1.3 Billion tokens are tradable on the market today).
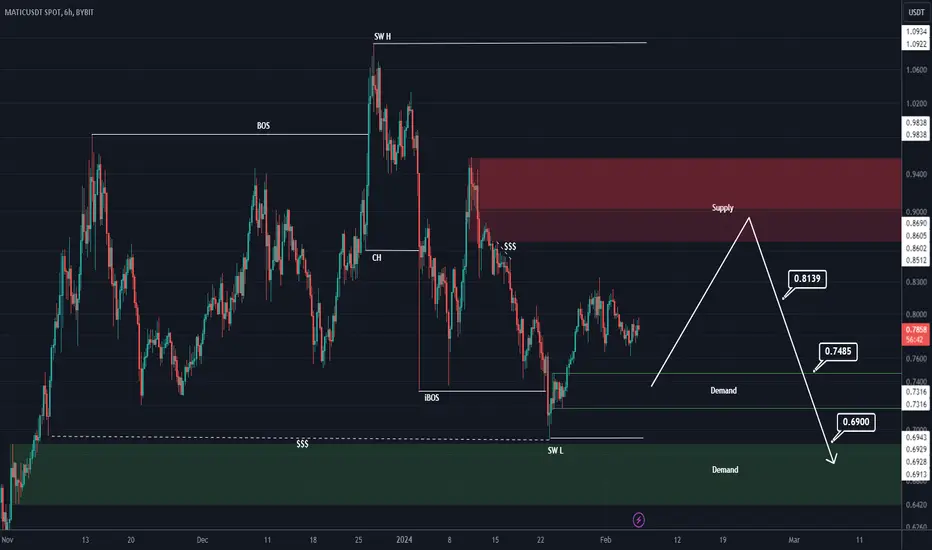
MATICUSDT

Matic analysis (4H)We have an important supply on the MATIC chart that may cause a drop or change the trend.
We have the change of structure with bearish CH on the chart and we also have supplies that have been mitigated and have moved sell orders to lower ranges with lower H and L.
In case of rejection from Supply, we have specified the targets and
For risk management, please don't forget stop loss and capital management
Comment if you have any questions
Thank You
MATIC ANALYSIS🔮 #MATIC Analysis 💰💰
🌟🚀 #MATIC is trading in a Symmetrical Triangle Pattern. The price is currently trading in a small zone below its descending trendline and a good bullish moment will be confirmed after a good breakout. 🚀🚀
🔖 Current Price: $0.7880
⏳️ Target Price: $1.5072
⁉️ What to do?
- We have marked some crucial levels in the chart. We can trade according to the chart and make some profits in #MATIC. 🚀💸
🏷Remember, the crypto market is dynamic in nature and changes rapidly, so always use stop loss and take proper knowledge before investments.
#MATIC #Cryptocurrency #DYOR

LUNAUSDT IDEAUPDATE
Falling wedge Breakout Has Already Confirmed Retesting In Process Successful Retest Can Lead Massive Bullish Rally Towards 0.900$✍️
COIN DETAILS
The live price of Terra is $ 0.641288 per (LUNA / USD) with a current market cap of $ 416.66M USD. 24-hour trading volume is $ 79.09M USD. LUNA to USD price is updated in real-time. Terra is +4.64% in the last 24 hours with a circulating supply of 649.72M.

TROYUSDT IDEAUPDATE
Formation of Falling Wedge in 3D Time frame.
Breakout can follow the arrow in due time !!!
COIN DETAILS
The live price of TROY is $ 0.002253 per (TROY / USD) with a current market cap of $ 19.44M USD. 24-hour trading volume is $ 756,574.95 USD. TROY to USD price is updated in real-time.

Bullish on Matic Swing LongI am too Buliish on this having alot in spot bags avg buy around 0.68
Longed it here with tight sl from 0.7980.
Stoploss at 7850.
Possibly it can hold here if hold here means reclaimed the trendline and this can Quick sent to 1.2 initially.
The real bull run on this will begin after 1.
HTF currently looks too Bullish.
Note: Not a Financial Advice.

MATIC → Polygon Pullback then Bounce to New Highs? Let's Answer.MATIC has been caught between a trading zone since November but has finally touched the Support Zone and bounced back above the Daily 200EMA. Should we long here?
How do we trade this? 🤔
The Support Zone was touched and a strong bounce led the price back above the 200EMA. We are currently hovering between the Daily 30EMA and 200EMA with no clear signals to buy or sell. The RSI is around 46.00 and above the Moving Average, another sign for a long position. The only thing we're missing is a solid Risk/Reward Ratio and a buy signal, which requires the price pullback a bit more before we can enter the market.
We ought to target at least a 1:2 Risk/Reward, but I believe we have the runway for a 1:3 Risk/Reward given the distance to the previous high of $1.092. Target the $0.735 price area for an entry and place a stop loss below the previous low in the Support Zone around $0.655, the first Take Profit at $0.815, and the final Take Profit around $0.975 or until you see a sell signal. Move the stop loss up to the entry price when Take Profit #1 is hit to lock in profits.
The first take profit is placed around the 30EMA zone since it may act as resistance. The second take profit is placed just before $1.00 where there has been a few failed attempts to break it since November.
💡 Trade Idea 💡
Long Entry: $0.735
🟥 Stop Loss: $0.655
✅ Take Profit #1: $0.815
✅ Take Profit #2: $0.975
⚖️ Risk/Reward Ratio: 1:3
🔑 Key Takeaways 🔑
1. Trading range after a bull run justified long bias.
2. Contact with the Support Zone followed by a bounce.
3. Price hovering between 30EMA and 200EMA, wait for pullback.
4. Look for long entry around $0.735 for a 1:3 Risk/Reward ratio.
5. RSI at 46.00 and above the moving average, supports long bias.
💰 Trading Tip 💰
It's reasonable to take half profits at the first resistance target in a long trade, or the first support target in a short trade. Using a 1:1 Risk/Reward Ratio for your first target, you can move your stop loss up to your entry price, locking in profits. This allows you to watch the rest of the trade execute without worry of losing money. This helps improve trading psychology and the equity in your account.
⚠️ Risk Warning! ⚠️
Past performance is not necessarily indicative of future results. You are solely responsible for your trades. Trade at your own risk!
Like 👍 and Follow to learn more about:
1. Reading Price Action
2. Chart Analysis
3. Trade Management
4. Trading Psychology

ICPUSDT IDEAUPDATE
Breakout of Bullish Pennant in 1D.
Successful breakout may lead +30% Bullish move in due time!!!
COIN DETAILS
The live price of Internet Computer is $ 12.72 per (ICP / USD) with a current market cap of $ 5.82B USD. 24-hour trading volume is $ 181.97M USD. ICP to USD price is updated in real-time. Internet Computer is +9.4% in the last 24 hours with a circulating supply of 457.65M. ICP Price History USD.

ROSEUSDT IDEAUPDATE
Breaking Bullish Pennant in 1D timeframe.
Holding of bullish wave may lead the price upto 30-35% increase!!!
COIN DETAILS
The live price of Oasis Network is $ 0.113985 per (ROSE / USD) with a current market cap of $ 765.25M USD. 24-hour trading volume is $ 56.23M USD. ROSE to USD price is updated in real-time. Oasis Network is +12.86% in the last 24 hours with a circulating supply of 6.71B.

MATIC ANALYSIS🔮 #MATIC Analysis - Breakout 🚀🚀
💲💲 There is a breakout of Falling Wedge Pattern in #MATIC and trying to retests the level. It's a 4hr time frame breakout and we can see more higher price in long-term. If the price closes above the major support then there will be a confirmation of bullish movement 📈📈
💸Current Price -- $0.7892
📈Target Price -- $1.0597
⁉️ What to do?
- We have marked crucial levels in the chart . We can trade according to the chart and make some profits. 🚀💸
🏷Remember, the crypto market is dynamic in nature and changes rapidly, so always use stop loss and take proper knowledge before investments.
#MATIC #Cryptocurrency #Breakout #DYOR

DOTUSDT IDEAUPDATE
Looking ready to break wedge.
Breakout can take on proceedings as we predicted !!!
COIN DETALS
The live price of Polkadot is $ 6.811449 per (DOT / USD) with a current market cap of $ 8.72B USD. 24-hour trading volume is $ 147.24M USD. DOT to USD price is updated in real-time.

AVAXUSDT IDEAUPDATE
Falling Wedge Breakout Has Already Confirmed Retesting In Process In case Of Successful Retest Expecting +40% Bullish Rally ✍️
COIN DETAILS
The live price of Avalanche is $ 34.03 per (AVAX / USD) with a current market cap of $ 12.49B USD. 24-hour trading volume is $ 448.47M USD. AVAX to USD price is updated in real-time. Avalanche is +4.5% in the last 24 hours with a circulating supply of 367.10M.

APEUSDT IDEAUPDATE
Broken Falling Wedge in 12H TF.
Can rise 40-45% in continuation !!!
COIN DETAILS
ApeCoin price moved +2.35% over the last 24 hours. The APE to USD conversion rate is currently $1.30 per APE and the circulating supply of ApeCoin is 607,970,310 APE. Therefore, the current ApeCoin market cap is $790,361,403.

POLSUSDT IDEAUPDATE
Formation of Bullish Pennant in 12H TF.
Breakout can take it towards 1.40💲 and above !!!
COIN DETAILS
The live price of Polkastarter is $ 0.730595 per (POLS / USD) with a current market cap of $ 72.49M USD. 24-hour trading volume is $ 2.47M USD. POLS to USD price is updated in real-time. Polkastarter is -4.87% in the last 24 hours with a circulating supply of 99.22M.

MAGICUSDT IDEAUPDATE
Looking ready to break pattern.
Breakout can take on proceedings as we predicted !!!
COIN DETAIL
The live price of Treasure is $ 1.306952 per (MAGIC / USD) with a current market cap of $ 337.54M USD. 24-hour trading volume is $ 266.56M USD. MAGIC to USD price is updated in real-time. Treasure is +15.53% in the last 24 hours with a circulating supply of 258.27M

CKBUSDT IDEAUPDATE
Ckb has Breaking Descending Triangle in Weekly TF.
Successful Breakout can lead 85-90% Bullish move !!!
COIN DETAILS
The live price of Nervos Network is $ 0.004111 per (CKB / USD) with a current market cap of $ 178.57M USD. 24-hour trading volume is $ 71.02M USD. CKB to USD price is updated in real-time. Nervos Network is +24.78% in the last 24 hours with a circulating supply of 43.44B. CKB Price History USD.

LINKUSDT IDEAUPDATE
Forming Bullish Flag in Daily.
Breakout can make a new high with 35-40% Bullish move ✍️
COIN DETAILS
The live price of Chainlink is $ 15.62 per (LINK / USD) with a current market cap of $ 8.88B USD. 24-hour trading volume is $ 521.89M USD. LINK to USD price is updated in real-time. Chainlink is +3.88% in the last 24 hours with a circulating supply of 568.10M. LINK Price History USD.

MATIC/USDT Could MATIC back to break resist or back to demand ?💎 MATIC has recently experienced significant developments in the market. Currently, MATIC has displayed strength by bouncing from the demand area, which previously acted as a supply zone. Moreover, it has successfully broken out of a descending channel pattern.
💎 If this breakout is valid, there is potential for MATIC to continue its upward trajectory and attempt to break through the resistance area. Breaking this resistance is essential because a successful breakout, probability could pave the way for MATIC to reach our target at the Bearish OB area.
💎 However, if MATIC fails to sustain its upward momentum and experiences a false breakout, there is the possibility that the price will retreat to the demand area to establish a new bullish momentum.
💎 The demand area holds significant importance, as a breakdown from this level could signal a return to bearish sentiment, potentially driving the price back towards the strong support area.

MATICUSDTMATICUSDT was trading in descending parallel channel. The price was reacting well the support and resistance of channel.
Currently the price has given the breakout of triangle and now retesting the broken level where it is also forming a local support zone and seems like the price may go for another leg higher.
If the breakout sustain to upside the optimum target could be 1.00
What you guys think of this idea?

ADAUSDT IDEAUPDATE
Breaking Falling Wedge In 4Hour Tf With Strong Volume , retest in process Incase Of Successful retest Expecting Massive Bullish Rally Towards 0.60-0.62$✍️
COIN DETAILS
The live price of Cardano is $ 0.481835 per (ADA / USD) with a current market cap of $ 17.06B USD. 24-hour trading volume is $ 404.55M USD. ADA to USD price is updated in real-time. Cardano is -5.81% in the last 24 hours with a circulating supply of 35.40B.

SOLUSDT IDEAUPDATE
Breaking Falling Wedge in Weekly TF.
Successful break out can initiate 40% Bullish move !!!
COIN DETAIL
The live price of Solana is $ 105.65 per (SOL / USD) with a current market cap of $ 46.01B USD. 24-hour trading volume is $ 3.15B USD. SOL to USD price is updated in real-time. Solana is +8.55% in the last 24 hours with a circulating supply of 435.50M. SOL Price History USD.

CFXUSDT IDEAUPDATE
Bullish rectangle Breakout & Retest Has Already Confirmed 📈📈📈
Holding of bullish wave may lead the price upto 30%💸 increase..
COIN DETAILS
Conflux (CFX) is worth ₹18.04 today, which is a 0.0% decline from an hour ago and a 2.9% decline since yesterday. The value of CFX today is 14.7% higher compared to its value 7 days ago. In the last 24 hours..

COSUSDT IDEAUPDATE
Breaking Falling Wedge with a very solid candle in 1D time frame.....
Successful breakout can see 15-20% Bullish wave.
COIN DETAILS
The live price of Contentos is $ 0.00777 per (COS / USD) with a current market cap of $ 39.74M USD. 24-hour trading volume is $ 2.67M USD. COS to USD price is updated in real-time. Contentos is +1.06% in the last 24 hours with a circulating supply of 5.11B.
