short MATICCRYPTOCAP:MATIC bounced off the resistance level and the descending trendline. Bearish movement to support level at 0.5$ is possible.
MATICUSDT

🔥GLOBAL OVERVIEW On MATIC For The Bull Market❗️MATIC is of the strongest altcoins among thousands of crypto. The previos bull market confirms it. The growth by 110 times after the triangle breakout!
💥 It capitalization have already reached $300M and it has potential but it's around 30-50x ($27-40 per coin).
Locally, Matic can grow to the top of the channel by +110% and make a pullback. I expect the growth after this pullback, but the growth continue if it break the triangle streight now.
like❤️ and follow
Check the links and get a BONUS🎁 from me👇

MATIC/USDT Technical Analysis: Deciphering the Chart SetupMATIC/USDT Technical Analysis: Deciphering the Chart Setup
Bullish Bounce from Symmetrical Triangle
MATIC currently trades around $0.65 after bouncing from the $0.52 level, which aligns with support of a symmetrical triangle on the daily chart.
Symmetrical triangles typically act as continuation patterns, so this bounce suggests a resumption of MATIC's uptrend within the triangle formation.
Favorable Higher Timeframe Structures
On the weekly chart, the symmetrical triangle takes shape as a larger bull pennant, which is also a bullish continuation pattern.
The confluence of constructive structures on the daily and weekly timeframes paints a positive picture for MATIC over the near term.
Measured Move Targets $1 Initially
The symmetrical triangle points to an initial measured move target of around $1 if MATIC can break out above the upper triangle trendline.
Reclaiming the key $1 level would likely propel additional upside momentum.
Potential for $5+ in a Bull Market
Looking longer-term, if MATIC breaks and holds above $1 decisively on the weekly chart, the bullish structures an extended move towards $5 first, with the potential for $10 in a sustained crypto bull market.
Monitoring Key Support at $0.50
If macro conditions worsen, keeping an eye on the $0.50 support level is prudent. A breakdown below $0.50 would invalidate the bullishness and introduce downside risk towards $0.20.

MATIC/USDT 1DInterval ReviewI invite you to review the MATIC chart in pair with USDT. First, we will use the blue lines to mark the upward trend channel from which the price broke out, creating a downward trend channel in which we could currently see the price leaving it with a sideways movement.
When we unfold the Fib Retracement grid, we can see that the price remained at the upper limit, a very strong fundamental support zone from $0.58 to $0.31.
Looking the other way, we can see a significant resistance zone from $0.74 to $0.90, only after we break out of it and then test it positively will we be able to see a further upward movement towards the second zone from $1.15 to $1, $33.
Please look at the CHOP index, which indicates that most of the energy has been used, while the RSI and STOCH indicators show that we are moving at the upper limit, which may negatively affect the price and provide a rebound in the coming days.

MATICUSDTIs MATICUSDT exhausting at highs?
As the price is been on high bull run but now it seems like price is lacking bullish momentum after printing double top pattern at resistance level and bearish divergence suggesting the sell pressure is about to start.
If the bears took control , the 1st target could be 0.5580
What you guys think of it?

MaticUsdtmatic for this bullrun is good nd safe currency on market
Remember nothing is 100% safe.
But larger projects are safer but may give you a metric profit in exchange for less risk
matic is one of these
These goals are ahead for Bullrun
Good luck
EntryPoint:
0.6100
0.5847
0.5621
0.5431
Supports:
0.5140
0.4791
0.4617
0.4380
Resistances:
0.6520
Targets:
0.6963
0.7654
0.8625
1.0048
1.0878
1.2195
MidTime:
1.5119
1.7598
2.1376
HODL:
2.6479
3.0847
3.7437
GL

Now 70% for MaticHello
Matic is struggling with trendline after breakout take long position.
Great divergence in RSI.

Bullish on MATIC (Polygon)It's about time to turn up, based both on MATIC/USDT & MATIC/BTC charts.
Buy 0.6~0.49
Sell 1.2~2.5
Stoploss 0.47

MATIC Surges 3% - Time to Long and Ride the Wave!MATIC token has experienced a remarkable surge, soaring up by a staggering 3% in just a short span of time! This is an exciting development that should not be overlooked, and I encourage you to seize this opportunity and consider going long on MATIC.
The recent 3% surge in MATIC is a clear indication of the growing strength and potential of this remarkable cryptocurrency. As traders, we are always on the lookout for promising opportunities, and MATIC has consistently proven itself as a force to be reckoned with in the market. This surge serves as a testament to the resilience and upward trajectory of this incredible token.
Now, you might be wondering why this surge matters and what it means for you as a trader. Well, let me tell you, it's time to get excited! A 3% increase may seem small to some, but it's the beginning of a potential rally that could propel MATIC to new heights. By going long on MATIC, you position yourself to reap the benefits of this upward momentum, potentially maximizing your profits in the process.
So, how can you take advantage of this exciting opportunity? It's simple! Consider opening a long position on MATIC, placing your trust in its potential for further growth. By doing so, you align yourself with the positive market sentiment surrounding this token, positioning yourself for potential gains as the price continues to climb.
Remember, the crypto market is highly dynamic and ever-changing. Opportunities like these are what make trading so thrilling and rewarding. However, it's important to always conduct your own research and exercise caution when making investment decisions. While MATIC's recent surge is a promising sign, it's crucial to analyze the market trends and indicators before taking any action.
As always, I encourage you to stay informed, keep an eye on the market, and make well-informed decisions based on your own risk appetite and trading strategy. Don't miss out on this exciting opportunity to long MATIC and potentially ride the wave of its upward momentum!
Wishing you profitable trades and an exciting journey ahead!

Polygon (Matic)Matic break daily and weekly trend.
Buy the retest and you have a trade with huge upside where you could use a quite tight stop loss.
0.55 is a area of interest (buy-retest).
I think that I weekly close as a confirmation of the break should give Matic som fuel to move fast!

matic/usdt time frame : 4HHi my friends
I think the matic/usdt will follow this path in the 4 hour time frame.
(small fluctuations are not considered)
Be sure to stick to the stop loss
(This analysis is my personal opinion. Be sure to prioritize your personal analysis)

MATIC is Ready For an Explosive Bullish Move 🚀| MATIC Analysis💎 Paradisers, stay alert! MATIC/USDT is currently traversing a demand zone, and we are holding a positive outlook for a potential upward journey.
💎 In the past few days, its movement has been restricted to a specific range. It previously faced resistance at the bearish order block, close to the $0.52 level.
💎 Given its ongoing upward momentum, MATIC appears ready to challenge this level once more.
💎 Keep a close eye on the supply zone and the bearish order block discerned on longer time frames; these are probable targets in the short term for Polygon.
💎 However, if the MATIC falls below the demand zone and vital support, be ready for a potential downward shift.
💎 Stay vigilant and keep an ear out for more insights! 🌴

MATIC/POLYGON - long position |AnalysisHello Traders, here is the full analysis.
Watch strong action at the current levels for BUY. GOOD LUCK! Great BUY opportunity MATICUSD
I still did my best and this is the most likely count for me at the moment.
Support the idea with like and follow my profile TO SEE MORE.
Traders, if you liked this idea or if you have your own opinion about it, write in the comments. I will be glad 🤝
Patience is the If You Have Any Question, Feel Free To Ask 🤗
Just follow chart with idea and analysis and when you are ready come in THE GROVE | VIP GROUP, earn more and safe, wait for the signal at the right moment and make money with us💰

0.3840-0.5620: Important boundary rangeHello?
Hello traders!
If you "Follow" us, you can always get new information quickly.
Please also click “Boost”.
Have a good day.
-------------------------------------
(MATICUSDT chart)
(1M charts)
The StochRSI indicator has entered the oversold zone and a change in slope has occurred.
Accordingly, the possibility of a trend reversal in the StochRSI indicator is increasing.
The key is whether the price can be maintained above 0.4010.
(1W chart)
On the 1W chart, the 0.559 point corresponds to an important support and resistance point.
Accordingly, the key is whether the price can be maintained around 0.559 and rise.
(1D chart)
With the 0.3840-0.5620 range as the boundary range, we believe that anything below 0.3840 corresponds to the mid- to long-term investment period.
Accordingly, if it falls below 0.3840, it is recommended to stop trading and wait for it to rise.
In order to reverse the trend, the price must be maintained by rising above the MS-Signal indicator on the 1M, 1W, and 1D charts.
Accordingly, the price must be maintained by rising above the M-Signal indicator corresponding to the MS-Signal indicator.
(MS-Signal indicator is composed of M-Signal indicator and S-Signal indicator.)
Since it has not risen above the MS-Signal indicator on the 1D chart, it has not been able to turn into a short-term upward trend.
Therefore, in order to turn into a short-term uptrend, the price must rise above 0.5620 and maintain the price.
-------------------------------------------------- -------------------------------------------
** All explanations are for reference only and do not guarantee profit or loss in investment.
** Trading volume is displayed as a candle body based on 10EMA.
How to display (in order from darkest to darkest)
More than 3 times the trading volume of 10EMA > 2.5 times > 2.0 times > 1.25 times > Trading volume below 10EMA
** Even if you know other people’s know-how, it takes a considerable amount of time to make it your own.
** This chart was created using my know-how.
---------------------------------

Dollar-Shop altcoins 💵 MATIC, SUI, ARBHi Traders, Investors and Speculators of Charts📈📉
For now, this is the last video in the 3-part series of altcoins that are trading well under 1 dollar. These coins make for great additions to a diversified portfolio AND with such a cheap price, why not get a few. You never know which one will 100x 🤑
SUI makes some great arguments in terms of fundamentals, including horizontal scalability and being able to directly pass an asset (such as an NFT), directly into a function argument; great for storage.
MATIC looking like it wants go head back to the 30's:
NOTE that these are accumulation ideas ideally. You can definitely swing trade once they have doubled, but keep a few around for incase one of them x10 or x100.
_______________________
📢Follow us here on TradingView for daily updates and trade ideas on crypto , stocks and commodities 💎Hit like & Follow 👍
We thank you for your support !
CryptoCheck
BINANCE:MATICUSDT COINBASE:MATICUSD BINANCE:ARBUSDT COINBASE:ARBUSD BINANCE:SUIUSDT BITSTAMP:SUIUSD

MATIC's Market ResilienceOn October 12, 2023, MATIC is priced at $0.5090, holding strong in a shaky market. Polygon (MATIC) has caught the market's attention mainly because of its Layer 2 scaling solution for Ethereum. This has led to increased interest from institutions, new partnerships, and a positive outlook in the crypto market, propelling a 57% growth since the start of 2023.
Most Probable Scenario:
The technical analysis for MATIC shows mixed signals with both bullish and bearish outlooks. On one hand, the inability to reclaim the 50-day EMA has triggered a sell-off, hinting at a potential test of the crucial $0.49 support level. Additionally, a possible bearish flag pattern suggests a further decline towards the $0.50 mark. On the other hand, Elliott Wave analysis presents a bullish outlook, hinting at potential upward movement in the near term.
MATIC's price behavior has shown similarities to Ethereum's past price action, suggesting a possible strong rally in 2023 if this pattern holds. Like Ethereum, MATIC's price was positively impacted by a bearish reversal on the U.S. Dollar (DXY), which could play a significant role in its future price movement.
In the short term, analysts project a price of $0.54246 by October 12, 2023, and $0.745609 by October 14, 2023. However, the general sentiment is leaning towards a bullish outlook for MATIC in 2023, especially if it continues to follow a similar pattern to Ethereum.
This analysis brings together a range of technical and fundamental factors that could affect MATIC's price. Continuous monitoring of market dynamics, particularly the U.S. Dollar trend and Ethereum's performance, alongside MATIC's fundamental developments, will offer a clearer understanding of its future price trajectory.

Inverse Cup and Handle - A Bearish Signal 🚫🐻There's a notable pattern emerging on the MATIC (Polygon) weekly chart that's raising eyebrows – an inverted Cup and Handle. This pattern is not to be taken lightly, as it signifies a strong bearish signal. If traders are considering short positions on this coin, they should watch for a retest of resistance and set their stop-loss orders above the pivot level. 📊
The Inverted Cup and Handle:
A traditional Cup and Handle pattern is usually a bullish indicator, but when inverted, it takes on a bearish connotation. In the crypto world, this pattern is a warning sign that suggests a potential price drop. 🚫🐻
Timing the Entry:
For traders looking to enter short positions on MATIC, patience is key. Wait for a retest of the resistance level before considering entry. This retest can confirm the strength of the resistance and provide a better entry point for short positions. 📉
Setting Stop-Loss:
Risk management is vital in trading. If entering a short position, set your stop-loss orders above the pivot level. This strategy helps limit potential losses if the trade doesn't go as planned. 💼🛡️
Final Thoughts:
The crypto market can be highly unpredictable, and technical patterns like the inverted Cup and Handle can provide valuable insights. However, it's essential to approach trading with caution and a well-thought-out strategy.
Traders should also stay informed about MATIC's fundamentals and any market news that could influence its price.
Bear in mind that trading in cryptocurrencies carries inherent risks, and it's essential to perform thorough research and use prudent risk management techniques.
❗️Get my 3 crypto trading indicators for FREE❗️ Link below🔑

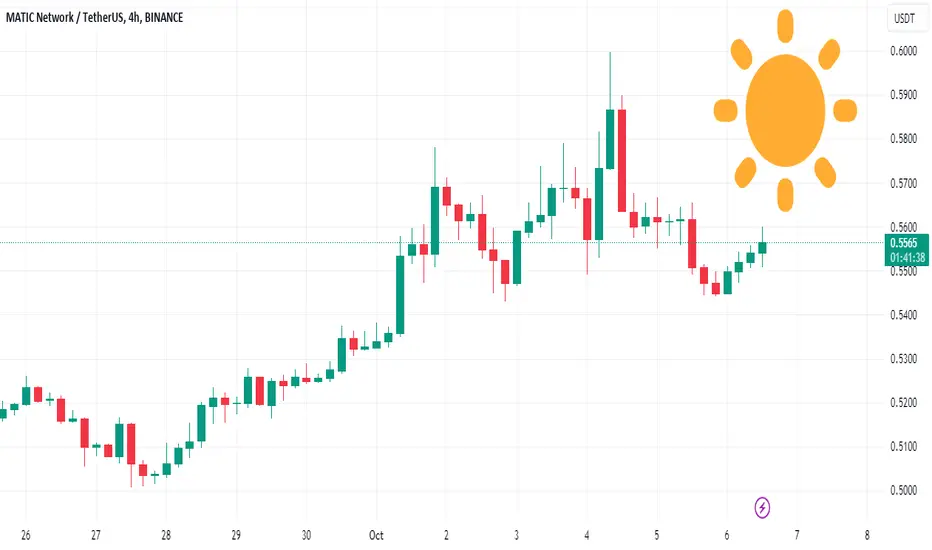
MATIC Faces Rain 🌧️, Next 24 Hours Bearish Cloudy ☁️, rainy 🌧️, and even stormy ⛈️ trading conditions lie ahead in the next 24 hours. This translates into a bearish market with downside risk for cryptocurrencies. Particularly Polygon, Ether, Cardano, and Polkadot may come under pressure.
Over a one-week horizon, the bearish trend will continue to linger over the crypto universe with Bitcoin being the notable exception. Slightly bullish sun ☀️ will shine over the world’s largest cryptocurrency with a possible upside in its price over this longer time horizon, ATTMO forecasts show.
Follow us for more crypto weather reports!

MATIC/USDT 1DIntervalI invite you to review the MATIC chart. As we can see, the price dropped below the blue EMA Cross 200 line, thus returning to the strong downtrend. However, here, after marking the downtrend channel, we can notice that the price breaks out of it sideways, which may have a positive impact on it and may translate into a change in direction.
When we unfold the Fib Retracement grid, we can see that the price has returned and remains in a very strong support zone that starts at $0.58 and continues up to $0.31.
Looking the other way, we can similarly determine the resistance areas that the price must face. And here we see that there was a strong rejection of the price from the zone from $0.74 to $0.90, but when the price breaks it, it will have an open path towards the second zone from $1.15 to $1.33.
The CHOP Index indicates that the energy is gaining more and more strength. However, the STOCH and RSI indicators show a visible recovery with room for the price to drop to a lower level.

MATIC - Elliott Wave Overview ✅Here we have the 2week chart of MATIC. We can see that we're in a clear bullish motive wave.
We are currently in wave 4 which appears to be a complex ABC wave.
We are looking for subwave c move higher to complete wave B.
Trade Idea:
- Entry on red trendline break
- stops below the lows once trendline breaks
- Targets: 1, 1.4, taper
Goodluck and as always, trade safe!

"Matic Unleashing the Potential of Layer 2 Scaling in Blockchain Riding a Bullish Wave Today
Matic Network (now rebranded as Polygon) is experiencing a remarkable bullish trend today. With its robust layer 2 scaling solutions for Ethereum, Matic has become a key player in the blockchain ecosystem. Its recent surge can be attributed to growing adoption by decentralized applications (dApps) and DeFi projects seeking to alleviate Ethereum's congestion and high gas fees. Additionally, Matic's commitment to interoperability with other blockchains has garnered investor confidence. As institutional interest in the broader crypto market continues to rise, Matic's innovative approach to scaling and its expanding ecosystem position it favorably for sustained growth in the near term.

MATIC Bullish 24-Hours and One-Week Horizon ☀️Bearish clouds ☁️ weigh on the global crypto market in the next 24 hours, signaling a downside risk. However, Cardano, Avalanche and Polygon face more lenient trading conditions, with ATTMO indicating some slightly bullish sun. ☀️
Over a one-week horizon, this slightly bullish sun is set to shine over both major cryptocurrencies – Bitcoin and Ether. ☀️ This upward trend is forecast to be even stronger for Cardano, Avalanche and Polygon.
Other coins, including Litecoin, Ripple, Binance Coin, Dogecoin and Polkadot won’t profit from this sun and will continue to face slightly bearish clouds. ☁️
Follow us for more crypto weather reports!
MATIC/USDT In the Crucial Zone, MATIC Need Bounce to Continue Up💎 MATIC is undeniably on our radar. Currently, it's nestled within a support zone after facing a staunch rejection from the daily resistance. This juncture will determine MATIC's next move: either ascend to re-challenge the daily resistance or descend towards the imminent demand zone around $0.537.
💎 If MATIC does dip to this demand and witnesses a strong rebound, it could be indicative of a liquidity sweep, which often precedes a significant bullish rally.
💎 However, should MATIC struggle to regain its footing in the support zone post touching the demand, it might be a red flag. This could suggest a potential further decline for MATIC, possibly towards the next support level and even potentially to the critical support zone.
