MATICUSDTIs MATICUSDT getting ready for some serious upside movement.
As MATIC printing successive HH and maintaining its inclining trendline seems like a buildup of bullish move.
MATICUSDT

MATIC/USDT 1DAY UPDATE BY CRYPTO SANDERSHello, welcome to this MATIC/USDT update by CRYPTO SANDERS.
CHART ANALYSIS:- Polygon (MATIC) Polygon (MATIC) snapped a three-day losing streak on Thursday, following a crossover of moving averages (MA).
The 10-day (red) MA crossed its 25-day (blue) counterpart in today’s session, sending the price to a peak of 0.8974.
This comes following Wednesday’s low at 0.8787, which saw MATIC hit its weakest point since May 25.
market volatility in polygon remains significantly high, with earlier gains almost fading.
MATIC is trading at 0.8934, with the RSI at a reading of 46.03, which is close to a ceiling of 48.00.
Should this aforementioned point of resistance be broken, bulls could force a move toward 0.9000.
Hit the like button if you like it and share your charts in the comments section.
Thank you

Polygon MATIC and the US Debt CeilingNegotiators from Democratic and Republican parties finalized an agreement on Sunday night.
Instead of raising the limit to a specific level, they have opted to suspend it entirely until 2025. This strategic move ensures that their bills can be paid until that date, while also guaranteeing that the next battle to raise the ceiling will not coincide with the upcoming presidential election.
The resolution of the debt ceiling issue brings optimism and stability to the financial landscape, which has a positive ripple effect on the cryptocurrency market.
Bitcoin and the broader crypto market stand to benefit from increased investor confidence, reinforced safe-haven status, enhanced institutional adoption, regulatory clarity, and the overall positive impact on global markets.
MATIC/USDT short
Entry Range: $0.85 - 9.91
Take Profit 1: $0.97
Take Profit 2: $1.10
Take Profit 3: $1.24
Stop Loss: $0.78

MATIC/USDT 1DInterval - Targets and Stop lossHello everyone, let's look at the MATIC to USDT chart on a one-day time frame. As you can see, the price is staying above the local uptrend line.
Let's start with setting the support line and as you can see the first support on which the price is currently based is $0.89, if the support is broken then the next support is $0.87, $0.84 and $0.81.
Now let's move to the resistance line, as you can see the first resistance is $0.91, if you manage to break it, the next resistance will be $0.93, $0.95 and $0.97.
Looking at the CHOP indicator, we see that there is some energy left for the next move, the MACD remains in an uptrend despite the correction, while the RSI has a small rebound, but there is still room for the price to go lower.

MATIC Network longMATIC Network bounced off the lower boundary of ascending channel. Bullish movement to resistance level at 0.953 is possible.

MATICUSDT testing two supports at onceHello everyone. In our studio today there is again a coin with a beautiful graph - MATICUSDT. Previously, there was already an idea for this coin, which achieved the goal. Now we have returned to the level from where the movement to the price of 0.95 began. The price is also supported by the trend line. Therefore, I consider it a good option to enter the coin on such support. With the same goal - 0.95. The stop is quite small - 0.8763.

MATICUSDT at daily support and likely to head upThe price is currently as daily support and bouncing from there. I expect it to go towards daily resistance marked on the chart. The only concern I have is the price did not tap into weekly support. It not necessary to do that and on many occasions it can just shy away, but I would have felt more comfortable with the current price action upward in case it has tapped the weekly support zone before. But the chart says its at daily support and shall go up.

Matic LongLonged some Matic here.
Possibly it could be a daily pullback and retest.
If we look at daily Chart we can clearly see the previous domain break and also daily closed above the domain.
Also BTC.D have some sort of divergence so the movement is prominent but still depends on BTC if BTC holds I can clearly see alts booming.
Longed some at 0.8677
Tp 1 0.9450
Tp 2 1.0300
SL 0.8550
Talking the trade because of very good RR here if this happens.
Note: Not a financial advice.

I Cannot Short This !!!🌟The MATICUSDT is in a Bullish phase by reaching a PRZ zone & is in a Falling Wedge Pattern.
🌟 Bullish signals in the PRZ area are:
- Support zone
- Pivot S1 monthly
- The Bottom of the Wedge area
- Falling Wedge Pattern
⭐ Note if the PRZ is broken downwards with the strength of Bearish candles or Wedge broken from the bottom , this analysis of ours will be failed.
✅If this post was useful for you, like it ❤️ and if you think it is useful for your friends, be sure to send it to them.
_ _ _ _ _ _ _ _ _ _ _ _ _ _ _ _ _ _ _ _ _ _ _ _ _ _ _ _ _ _ _ _ _
🌍Thank you for seeing idea .
Have a nice day and Good luck.


Will MATIC falter at this level?MATIC’s price action rebounded from the mid-range.
The range low is a confluence of a bullish OB in H12 formed on 16 May and another bullish OB formed in H2 on 14 May.
A price rejection at the short-term range high could drag MATIC lower.
Entry: $0.89
Target: $0.84
Stop-Loss: $0.91
RR - 2.8


MATICUSDT are you rdy ?😉🧨I have good news for shorts holders and bad news for matic holders
Bad news because this currency is falling, its price is set in dollars, and good news for short sellers because I marked the entry and specified my target.
The first target will be $0.5413, and the second target will be $0.3410. Enjoy, smart guys.

$Matic - Classic chart - 80% Drop - Target $0.25Matic printing Bearish Flag pattern, can potentially drop over 80%
Matic & Bitcoin has similar pattern & Check out the comparison
Target $0.25

Stop Losses: A Trader's Best DefenseIn a perfect world, every trade would go our way, but alas this is usually not the case. A stop loss is a risk management tool used by traders and investors to minimize their losses when trading. It is a predetermined price level at which a trader's position will automatically exit the market, causing the loss to be realized. Stop losses are crucial to any trading strategy, as they help traders limit their losses and stay disciplined. In this blog, we will look at what stop losses are, why they are important, how to set realistic stop losses, and five different examples of stop losses with a description of how to set the stop loss.
What are Stop Losses?
A stop loss is an order to sell a security when it reaches a particular price. It is a predetermined price level at which a trader's position will automatically exit the market, causing the loss to be realized. This means that if the price of the security falls to the stop loss level, the trader's position is automatically closed, and any losses incurred are limited to that level. Stop losses are essential because they help traders limit their losses and stay disciplined.
Why are Stop Losses Important?
Stop losses are important because they help traders limit their losses and stay disciplined. In trading, it is easy to become emotional and let your losses run. Stop losses help traders avoid this situation by automatically exiting the market when the price reaches a predetermined level. This ensures that losses are limited, and traders can move on to the next trade without being emotionally affected by the previous loss.
Setting Realistic Stop Losses
Setting realistic stop losses is crucial to any trading strategy. A trader needs to consider the volatility of the security, the trading style, and the risk-reward ratio when setting stop losses. The stop loss should be set at a level where the loss is acceptable but not too close to the current price level, as this may result in the stop loss being triggered prematurely. A stop loss should also not be set too far away from the current price level, as this may result in the trader losing more than they are willing to risk.
Stop Loss Examples
Below we will list five examples of setting effective stop losses. For consistency, we are going to use the same long stop loss example, but these same examples can be set for stop losses for short positions as well.
Percentage-Based Stop Loss: A percentage-based stop loss is a stop loss that is set at a specific percentage below the purchase price. For example, if a trader wants to place a long at $0.088602 and sets a 0.5% stop loss, the stop loss would be triggered at $0.88160. For a short stop loss at 0.5%, you would add the value instead and have a 0.89035 stop loss. To set a percentage-based stop loss, the trader needs to determine the percentage they are willing to risk and place the stop loss order at that level.
ATR-Based Stop Loss: An ATR-based stop loss is a stop loss that is set based on the average true range of the security. The average true range is a measure of volatility and is calculated by taking the average of the high and low prices for a particular period. To set an ATR-based stop loss, the trader needs to determine the number of ATRs they are willing to risk and place the stop loss order at that level. For a long stop loss, you would subtract the ATR times its multiplier from the current price. For a short-stop loss, you would add the ATR times its multiplier to the current price. The unique upside to this stop-loss style is the ATR accounts for market volatility which can aid your risk management and help set more appropriate stop losses.
Using Moving Averages or Super Trend: Moving averages and super trend are technical indicators that can be used to set stop losses. Moving averages are calculated by taking the average price over a specific period, while the super trend is a trend-following indicator that uses the average true range to calculate the stop loss level. To set a stop loss using moving averages or super trend, the trader needs to identify the period and place the stop loss order at the appropriate level. The Moving Average or Supertrend can then act as a moving stop loss as it trails the price.
1. Moving Average:
2. SuperTrend:
Donchian Channels: Donchian channels are a technical indicator that can be used to set stop losses. Donchian channels are created by taking the highest high and lowest low over a specific period and plotting them on a chart. To set a stop loss using Donchian channels, the trader needs to identify the period and place the stop loss order at the appropriate level. In the example below we use a more standard 20-period Donchian level to identify areas of lowest low interest that would be a good place for a stop loss. If we were setting a short order we would look to recent highest highs as potential stop-loss areas
Conclusion
Stop losses are crucial to any trading strategy, as they help traders limit their losses and stay disciplined. When setting stop losses, traders need to consider the volatility of the security, the trading style, and the risk-reward ratio. Stop losses can be set using many different techniques, including percentage-based, ATR-based, using moving averages or super trend, and Donchian channels. By setting realistic stop losses, traders can minimize their losses and stay disciplined, which is essential for long-term success in trading.

MATICUSDT and double bottomHello everyone. Today we will consider MATICUSDT for the short term. The coin drew something similar to a double bottom. Another good thing is that the price does not update the minimums. Therefore, the feeling is that we will go higher, to 0.958. We will put a stop somewhere 0.8668, behind the trend line.

ADA, MATIC, AVAX Shining Bright 🌴☀️🔥 What About BTC, ETH? Tropical conditions 🌴 – very bullish with some upside potential – are predicted for Cardano, Avalanche, and Polygon in the next 24 hours. This means that a slightly bullish market with upside potential is highly likely.
Sunny weather with a few scattered clouds 🌤️ lies ahead for the global crypto market, including Bitcoin and Ethereum. Investors anticipate a US debt ceiling deal. Over a one-week horizon, ATTMO expects cloudy weather with some sun 🌥️ for Bitcoin and Ripple, translating into a slightly bearish market with downside risk.
Follow us to stay updated with more crypto weather insights and reports!🌩️⛅🌈

long MATICCRYPTOCAP:MATIC broke through the descending trendline and the resistance level. Bullish movement to resistance level at $0.95 is likely to happen.

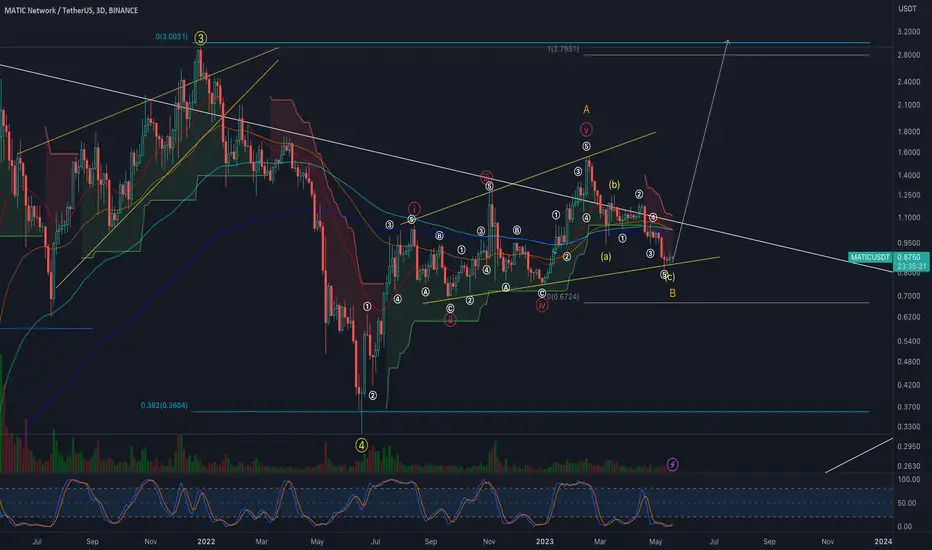
✴️ Looking Into Polygon's Correction To A New Higher HighPolygon's correction, MATICUSDT, has been going now for more than three months.
The total drop amounts to 48% from Febs peak price to May's low.
The current price is trading below the 0.786 Fib. retracement level support...
A very strong correction by all standards but MATICUSDT continues trading within a higher low (compared to its late Dec. 2022 low).
Hidden bullish divergence on the RSI.
Very low bear volume on the last low with the session,12-May, closing green.
Looking at Litecoin and Lido, for comparison, we can start to speculate that the correction low is more likely than not to be in.
The low volume is quite telling.
The entire correction phase, 90 days, produced very little volume compared to the bullish wave, 49 days...
These are bullish signals.
A higher low can lead to a higher high... Patience is key, but what comes next will be twice what we saw in late January... It is about to get good.
Namaste.

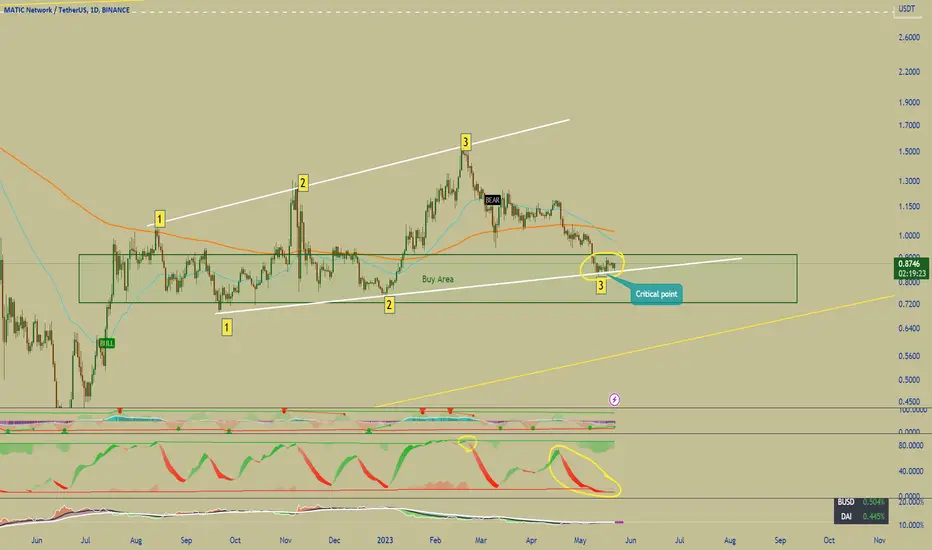
MATIC Critical support directionHey guys, here what a new update in MATIC.
Using the Daily chart;
>Price ended up falling all the way to the local support at 0.85. Support has been holding well so far so a critical movement is about to occur either UP or DOWN.
>IF price breaks below the white support line ,we will be likely heading close to or into the next support located at 0.61.
>IF price breaks above long term target is $1.7 and $2.8 bullish scenario.
>this is a CRITICAL support area and 0.85 is a very important support so i am expecting a big movement either up or down.
>Both support and resistance of the wedge seem to hold and be important as they have served their purpose 3 times each.
For the trader who wants to trade this chart, draw the wedge and place alarms below the support in case we break to the downside.
MATIC LONG OPPORTUNITYMatic has been 38 Days exactly in sideways action. I believe a big movement is going to occur on MATIC either UP or DOWN. It looks like a good trade with a goodrisk : reward so its definitely worth taking the shot. BNB was broken out of the symmetrical triangle so I will assume MATIC is going to follow the same steps as they both go together and Binance owns MATIC. I may still be wrong but its worth the risk taking.

MATICBTCA double bottom or double bottom pattern at the end of a descending angle pattern indicates a temporary uptrend
Of course, we must allow the upcoming resistance to be broken at 0.0000339

matici got matic about bottomed and finished with the HTF B wave. Now loading C wave back to $5 plus