MATICUSDTSeeing this Adam and EVE top on the 15 mins in alot of coins and Bitcoin also
Here's the interesting thing its happening as we restest our failed previous support.
Could be an amazing Long term short entry.
Lets see how it plays out.
MATICUSDT

The birth of a new strongman???Hello?
Traders, welcome.
If you "Follow", you can always get new information quickly.
Please also click "Boost".
Have a good day.
-------------------------------------
(MATICBTC 1W chart)
If price stays above the uptrend line (1), it is expected to renew a new ATH.
It seems to be a coin with a very high possibility of becoming a new powerhouse.
Therefore, it is necessary to check the movement of coins (tokens) related to the Polygon coin ecosystem.
----------------------------------------
------------------------------------------
(MATICUSDT 1D chart)
The question is whether it can break the uptrend line by moving higher above 1.3340.
If not, you should check for support around 1.0731-1.1688.
If it fails to move above 1.3340, a pullback towards 0.8647, near the lower end of the rising channel, is likely.
So, you need to see if there is any movement coming out of the uptrend channel.
-------------------------------------------------- -------------------------------------------
** All descriptions are for reference only and do not guarantee profit or loss in investment.
** If you share this chart, you can use the indicators normally.
** The MRHAB-T indicator includes indicators that indicate points of support and resistance.
** Check the formulas for the MS-Signal, HA-Low, and HA-High indicators at ().
(Short-term Stop Loss can be said to be a point where profit or loss can be preserved or additional entry can be made by split trading. This is a short-term investment perspective.)
---------------------------------

MATIC/POLYGONIm Expecting price to go lower.
Trade base on your own decissions.
Come and check me out for more

MATIC/USDT CorrectionMatic needs correction on Binance 4h chart pattern, 10 % Correction is completed how more correction requires ? Mostly coins were 20 % correction after its peak performance, Matic has completed its 10% and 10 % Remains , if you have any idea please paste your idea in comments area.

Matic short using 4 Hour OB [Active Trade]I am currently in this short on Matic.
I took this at a 4 Hour Order Block at a key level of resistance.

Matic strong demand, waiting for a trendline break to shortMatic shows strong demand in comparison to other alts. Waiting for a trendline retest and a possible short entry below 1.24 level which also confluences with MAs.

I am shorting MATICI am shorting Matic from last week high due to bearish news and BTC going down. While short keep eye on TA on 1h chart.

Matic Weekly View - February 2023Hello Guys, Weekly Analysis is on the MATICUSDT Symbol in a 4H Time frame, I Hope it Will be Useful for You, Don't Forget to Like, Follow, Comment

MATIC is at Resistance, Will We See a Breakout?MATIC is currently at the $1.32 resistance. Can it break through and head toward the all-time high?
About MATIC: Polygon (MATIC) is a blockchain platform that provides Ethereum compatibility through its Layer 2 scaling solution. It aims to solve scalability issues in the Ethereum network, and make it easier for developers to build and deploy decentralized applications (dApps). Polygon has been making waves in the cryptocurrency world due to its innovative approach to solving the scalability issue and its potential to revolutionize the Ethereum ecosystem.
MATIC, a Different Cryptocurrency
MATIC has been behaving differently from the rest of the cryptocurrency market. Unlike other cryptocurrencies that reached their lowest levels in November following the FTX crash, MATIC hit its lowest level in June 2022. This shows that MATIC has been resilient and has followed a different trend than the rest of the market.
After reaching its lowest level, MATIC has been mainly ranging between $0.70 and $1.00 from July 2022 to January 2023. However, at the end of January 2023, it broke above this range and is now heading toward the $1.32 resistance level. If MATIC successfully breaks this resistance, it will likely head toward its all-time high of $2.91.
However, if the resistance holds, MATIC will head toward the $1.00 support level. Additionally, there are 2 more support levels at $0.70 and $0.30, but it is improbable that MATIC will reach the $0.30 level considering the current market conditions. The key to predicting the future price of MATIC is to keep a close eye on how it behaves at the current resistance level.
Looking Ahead: Polygon (MATIC) is a promising project that has the potential to revolutionize the Ethereum ecosystem by providing a scalable solution. With its strong performance, MATIC is a cryptocurrency worth keeping an eye on in the coming months.

MATICMonthly MATIC chart shows MATIC breaking the 8 month marco down trend line since 2021 highs.
Should be on our way to wave 5 now, ending around $9.50

MATIC: Approaching ResistancePolygon (MATIC) technical analysis:
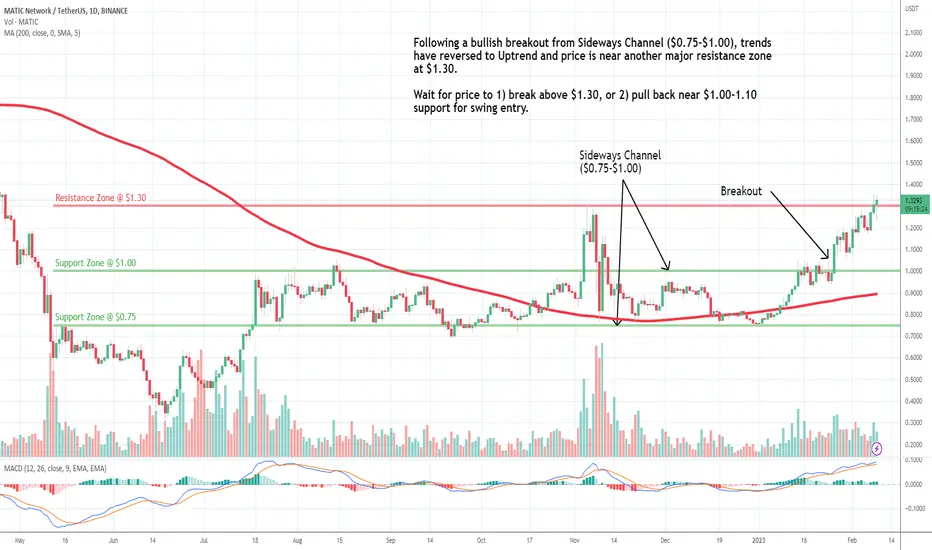
Trade setup : Following a bullish breakout from Sideways Channel ($0.75-$1.00), trends have reversed to Uptrend and price is near another major resistance zone at $1.30. wait for price to 1) break above $1.30, or 2) pull back near $1.00-1.10 support for swing entry.
Trend : Uptrend across all time horizons (Short- Medium- and Long-Term).
Momentum is Bullish but inflecting. MACD Line is above MACD Signal Line and RSI is above 55 but momentum may have peaked since MACD Histogram bars are declining, which suggests that momentum is weakening.
Support and Resistance : Nearest Support Zone is $1.00 (previous resistance), then $0.75. The nearest Resistance Zone is $1.30.
MATIC holders, still 23% of potential profit !#MATIC / USD Update:
$MATIC is currently trading at $1.33
According to Coinlion Trend Trader Indicator, MATIC is currently bullish (he is in the ascending channel since July 18th 2022)
Entry point : $0.86
Profit Point : $1.64 (93% profit)
The next possible target would be the top of the channel at $1,64 (23% profit more)
What do you think ?
Please click LIKE button and Appreciate my work.
Coinlion Trend Trader indicator tells me when to enter short or long, when to exit and when to take profit :-)
Thank you.

MATICUSDT, key zones to watch and next move. UpdateHello guys, This is an update of previous analysis (blow link). Everything is explained on the chart for you like always. The price is currently moving as we expected and reached first target with 48%. So you can manage your positions and it's better to save profits because of major resistance, divergence in RSI and market's sentiment. Then continue to reach the second target. The targets will be 1.6 and 1.7 .
Good luck.
If you like the idea, do not forget to support with a like and follow me for next analysis :)
Write your comment and opinion below to me

MATICUSDT: Long Position to 2.7159Hey guys. According to the chart we see in the correction waves "abc" and to completed to the c wave at 2.7159 . Be enjoy and share friends

MATIC / USDT 1D chart Resistance and SupportHello everyone, I invite you to review the MATIC chart in pair to USDT, on a one-day timeframe. First, we will use the yellow lines to mark the uptrend channel in which the price is currently moving.
Moving on, we can move on to marking support areas when we start a larger correction. And here the first support is at $1.11, the second support is at $0.95, then we have support from $0.83 to $0.71, then the price may drop to around $0.53.
Looking the other way, we see that the first strong support is at $1.45 and then we have support at $1.75. However, before that, the price must maintain the level of $ 1.31 at which it turned back last time.
Take a look at the CHOP index, which indicates that the energy is being used for an upward move, the MACD indicates that we are moving in an uptrend, while the RSI is moving in the upper range, which may indicate an imminent rebound.

Matic updateWhat Is Polygon (MATIC)?
Polygon (previously Matic Network) is the first well-structured, easy-to-use platform for Ethereum scaling and infrastructure development. Its core component is Polygon SDK, a modular, flexible framework that supports building multiple types of applications.

POLYGON MATIC SHORT TRADE Heres a Quick SHORT SETUP
entry - 1.1718
stop-loss 1.922
Take profit 1.112

Matic/USDT Elliott Wave count DailyABC correction for Matic ? or is start of a 3rd wave?
Wave B extended flat with C wave an ending diagonal.
Targets for a possible C wave into the box.

$MATIC #MATIC | LTF SHORTThe red box most probably will work as resistance so i looking at bearish breakers (retracement etc.) around $1.29 .
If the price loses redbox ASAP, the price may dump more than we expect.
Resistances can be seen in the chart.

MATIC– Very clear uptrendMATIC– Very clear uptrend
This Sunday's drop did not affect MATIC at all, which is firmly following its upward path, reinforced by the buyer RSI, moving averages pointing upwards and at this moment MATIC is licking the base of the Bollinger Band, which makes the MATIC chart so extremely positive.
Here are the supports and resistances in the 4H:
Main support levels: 1.1681 / 1.1061
Main Resistance Levels: 1.2241 / 1.2714

MATICUSDTHello Crypto Lovers,
Mars Signals team wishes you high profits.
This is a 4-hour-time frame analysis for MATICUSDT
There is R1 as a resistance area which represents the unsuccessful triumphs of the price to rise at several points. And S1 and S2 used to be resistance areas in the current chart. At the moment, we observe the fluctuation of price below R1 after its falling trend to this point by reaching R1 and our expectation would include more decline for the price to reach S1. So by having some rising signs, there would be an increase predicted for the price to reach R1 or even higher than that. But if the price loses the support and falls toward S2, more decline would happen to it downward. Do not forget to consider the market situation in lower time frames and then decide what to do; based on the multiple pieces of information which you would obtain from our updates and analyses.
Warning: This is just a suggestion and we do not guarantee profits. We advise you to analyze the chart before opening any positions.
Wish you luck

Trippy! MATIC Head & Shoulders 5 DAY INVERTED CHART!We've been in a bear trend for a while, so we are used to looking at down-trends. So..look at MATIC Polygon in the 5 Day time frame, huge Head and shoulders forming, and if this chart plays out, remember it's INVERTED target is $1.60 the common FIB 0.5 retracement of actually increase.
Really Trippy buy if you understand it Matic could have enough steam, but HOT already, Only one or 2 more 5 day periods left before a big marklet cool off, shows in BTC also.
REMEMBER INVERTED CHART

maticguys if you go to my previous ideas when all this bullrun started 2 month ago you will see the line in pinck that i marked. i was the only one in all the trading view thing that said this would happen.
see it donwn there. i posted it on september.
Amazing
