Matic lover hey user
i was give you buy level last from spot level this is super hit and brake the level.
now new user wait for entre level this will be make a littel down and buy and if brake the old level then you can see new high
so best of luck long investor
i will put our latest news channel soon
MATICUSDT

This my Matic/polygon scenarioVery soon i am awaiting drop to support area.... Bounce from red zone to blue.
Negative if it breaks already red trend line

MATIC Weekly View - February 2023Hello Guys, Weekly Analysis is on the MATIC Symbol in 4H Time frame, I Hope it Will be Useful for You, Don't Forget to Like, Follow, Comment

MATICUSDT4HI've been watching MATIC hold above the 200-day moving average since the 9th of Jan. And while this move has been very exciting, remember that the 200MM acts like a magnet pulling the asset to wherever it is.
MATIC will largely follow its upward moves following its uptrend. At this moment it is approaching the upper edge of the Keltner Channel and once there it can backtrack. The trend is upwards and the prognosis is very good, also due to strong institutional adoption.
MATICUSDT 4H
Here are the supports and resistances in the 4H:
Main support levels : 1.1709 / 1.0960 / 0.9640
Main Resistance Levels: 1.2779 / 1.3136
I'm not a financial consultant. The content I share on this site is for educational purposes and is my own personal opinion.

MaticUSDT4Hr time frame:
Matic is likely to face resistance and it is stong pattrens are about to complete..use strict stoploss and new entires shoud be after breakout
short position is likely to be activated.
Harmonic also near to completion.
Let the odds in our favour;
Do comment and reviews and feedback are welcomed...

POLYGON: The darkest horse on the crypto hippodromePolygon is Ethereum's first successful L2 solution. Aside from the main product, Polygon blockchain, the project also offers solutions based on the ZK and SNARK algorithms.
One of the main narratives for 2023 is blockchain and ZK-based solutions; we can assume that when zkSync, StarkNet, and other similar projects emerge, Polygon will grow alongside them, because market participants will find that all of these technologies are already implemented and used in Polygon.
Current metrics
Price: $1.09
ATH price: $2.8
M.cap: $9.5b
ATH M.cap: $20.5b
FDMC: $10.8b
Price change in a year: -57%
Maximum price change in a year: -87%
Polygon partnerships deserve special attention:
Meta
Nike
Htc (smartphones production)
Reddit
Robinhood
JPMorgan
DraftKings
Adobe
Liverpool
Starbucks
Adidas
Prada
Stripe
Nothing
NFL
Why is Polygon one the most prospective projects of the future?
While Ethereum solves scalability and gas price reduction issues
Solana is trying to address user churn, liquidity, and network sustainability issues
Near is trying to establish itself in the market, develop marketing strategies, and attract developers
Aptos is emerging as an ecosystem
Sui, Sei, Arbitrum, ZK and STARK are getting ready to go to market
Polygon is fully committed to becoming a mass-adoption solution and collaborating with as many real-world companies as possible. The next bull cycle will be based on mass adoption and engagement, which requires companies with a user base and products that are used by the masses.
Polygon is aggressive, and the average user is much more likely to hear about Polygon than Aptos/Solana/Near. Polygon develops solutions that, like Ethereum, do not require high transaction costs. Polygon has a well-established ecosystem and its own user base. Polygon has a chance to become the most widely used blockchain project.
Share your thoughts about Polygon in a comments section with us and check links below to trade Polygon with our exchange!
Thanks for reading!

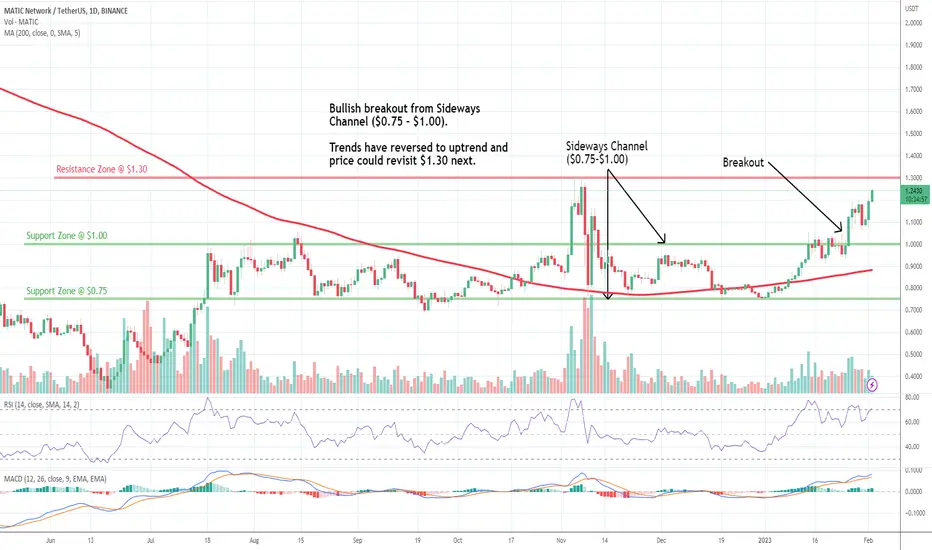
MATIC: Sideways Channel BreakoutPolygon (MATIC) technical analysis:
Trade setup : Bullish breakout from Sideways Channel ($0.75-$1.00). Trends have reversed to Uptrend and price could revisit $1.30 next.
Trend : Uptrend across all time horizons (Short- Medium- and Long-Term).
Momentum is Bullish (MACD Line is above MACD Signal Line and RSI is above 55).
Support and Resistance : Nearest Support Zone is $1.00 (previous resistance), then $0.75. The nearest Resistance Zone is $1.30.
MATICUSDT, key zones to watch and next move. UpdateHello guys, This is an update of previous analysis (blow link). Everything is explained on the chart for you like always. The price is currently moving as we expected, So you can manage your positions and profits until you reach the first target. Consider that the market is dispose to small correction. The targets will be 1.3 and 1.7 .
Good luck.
If you like the idea, do not forget to support with a like and follow me for next analysis :)
Write your comment and opinion below to me

#Matic in Binance Up Trend
T1=1.7
T2=2.6
T3=3.8
Sl=0.9
The price trend is upward. Matic is close at about $4

long MATIC$MATIC faced a strong support near the 0.5 Fibonacci level. Bullish trend is likely to continue and reach the resistance level at 1.2$
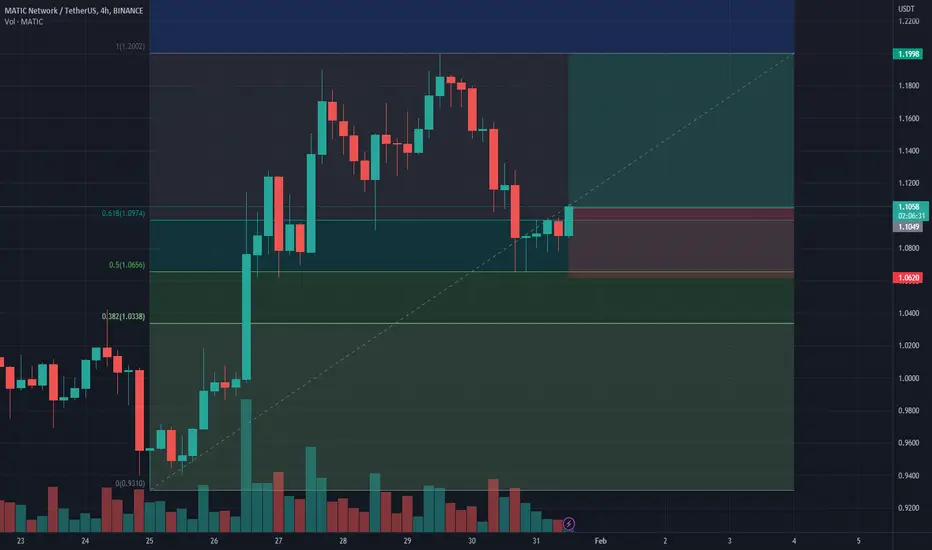
MATIC♾️ breakoutWassup guys! Polygon broke up this triangle📐 and I think there is chance for run to 1.1340 and even higher, but we could see some correction first. I traded the initial breakout but one can set BUY LIMIT order to previous range high to catch🎣 the potential pullback. As always ... don't chase the market, let the market come to you.
ENTRY : local high @ 1.0185
STOPLOSS (SL) : local low @ 0.9760
TARGET (TP) : height of the triangle projected from midpoint of the local range (BUY LIMIT - STOPLOSS) @ 1.1340
REWARD RISK RATIO (RRR) : 2.65
INVALIDATION : when SL level hit
Check my other stuff in related ideas.
Please boost🚀, comment🗣️, follow me✒️, enjoy📺!
⚠️Disclaimer: I'm not financial advisor. This is not a financial advice. Do your own due dilingence.

Polygon (MATIC): Target 1 and 2 hit! ...and now what's the next?Hi everyone!
The short-term technical structure is still very interesting and Polygon (MATIC) seems to still be projected to the upside again. After hitting our first two targets (see chart below), either before or after a corrective structure, I expect to reach my last target around 1.15 area, so I'll try to add Long positions on short-term pullbacks. The chart shown is in logarithmic scale on one hour time frame.
PREVIOUS ANALYSIS
(Click on chart below)
If this idea will be supported by your "Likes" we will continue to follow the crypto with updates below.
thanks for your attention and please... trade with care! 💖

MATICUSDT 4HMATIC has gained over 52% in its value since January 1, 2022.
MATIV is on a spectacular upward move, forming an ascending wedge where MATIC is heading towards its upper edge at $1.0250, and could then see a pullback, not just technically speaking, but also by the calendar full of economic data and bank decisions center and all the geopolitical tensions. Be very cautious during the week. RSI pointed upwards also indicating a strong appetite for buyers.
Here are the supports and resistances:
Brackets: 1.0465 / 1.0496
Resistances: 1.2050 / 1.2406

Matic Weekly View - JANUARY 2023Hello Guys, Weekly Analysis is on the Matic Symbol in a 4H Time frame, I Hope it Will be Useful for You, Don't Forget to Like, Follow, Comment

MaticUsdt idea✅ ✅ Risk warning, disclaimer: the above is a personal market judgment and analysis based on published information and historical chart data on The trading view,
And only some of these analyzes are my actual real trades.
I hope Traders consider I am Not responsible for your trades and investment decision.

The next targetsThe buying pressure under the resistance range of 1.055 dollars caused this resistance level to be broken. Therefore, the next target of buyers can be considered in the range of 1.25 to 1.30 dollars. Also, breaking this resistance has caused the price to exit the range channel, which we can consider a higher target as the second target for MATIC. This resistance is considered in the range of 1.61 to 1.71 dollars.

MATIC/USDT :: Soon the triangle will be broken !!!MATIC/USDT :::
Price ceilings are formed on the same level and price floors are closed above each other, and these events have caused a great triangle to form.
The best thing to do in such cases is to wait until the price finds its way and exits the triangle .

Polygon MATIC leaving the penny crypto area after last Fakeout⁉️MATIC leaving the penny crypto area after last Fakeout⁉️
Like in Stock Market the $1 mark is important for cryptocurrencies as well
Just see Polygon price reaction on the chart
Let me know your thoughts in the comments🤗
⬇️⬇️⬇️
Likes and Follow for updates appreciated🤗
Disclaimer:
Not financial advice
Do your own research before investing
The content shared is for educational purposes only and is my personal opinion

MATIC 3D BUYMATIC 3D support is now at ~$0.82
Enter 50% at the current price
and try to set some BUY orders near the support zone
If MATIC stays above the trendline,
the Take-Profit target would be 5%, 10%, and 15% from your entry
Cheers


Complex Situation for Matic!maticusdt have complex narrative!
in daily timeframe price reach to $1.29 and now $1.1348 has strong resistance.
if the price unable to pass it, $0.91~$0.85 first support zone and after that $0.74~$0.62 will be second support zone.
$1.55~$1.75 will be first target of bullish senario...

Polygon (MATIC): ...bullish continuation in short term?Hi everyone!
Polygon (MATIC) has triggered a beautiful rally that we have followed in the last few weeks (see chart below), having said that, the trend is still bullish on intraday chart and from a technical point of view, it should be Long on all pullbacks in small times frame.
PREVIOUS ANALYSIS
(Click and Play on chart below)
Thank you for support and your "Likes" ....we will continue to follow the crypto with updates below!
thanks for your attention and please... trade with care! 💖

MATIC/BTCOk, Polygon have 13 red daily candles in a row! It´s a lot :D..
I reckon that if Bitcoin keeps falling, Matic will probably follow him, but I won't miss this purchase (who knows).
In addition, MATIC can be well evaluated by staking, and also it is one of best alt, so HODL.
My position 2233..
