matic usdtbreakout on time frame 1d,nice for long therm breakout on time frame 1d,
tp 1 = 1,45
matic usdtbreakout on time frame 1d,nice for long therm
MATICUSDT

$MATIC - coming to LifeHello my Fellow TraderZ,
It seems #POLYGON ($MATIC) is breaking of the SYMMETRICAL TRIANGLE and looking forward to test its immediate resistance area ~ $1.25.
Most of the coins have pumped but $MATIC is lagging among them. Follow #BTC also if it pullbacks, $MATIC is no exception and will se the support below.
Happy Trading Fam. CHEERS!!!

MATICUSDT LONGHere we can see that "MATICUSDT" in 1 hour time frame is forming a BULLISH DIVERGENCE and also the STOCASTIC RSI is trying to reach the overbought zone from the oversold zone. So we can look fr a good LONG OPPORTUNITY here and you can use the target and entry as given in the screenshot.


MATICUSDT, key zones to watch and next move. UpdateHello guys, This is an update of previous analysis (blow link). Everything is explained on the chart for you like always. We said that the price has the potential to break its resistance and now the resistance is broken and IF the pullback is confirmed, it will continue to reach the target. The targets will be 1.3 and 1.7 .
Good luck.
If you like the idea, do not forget to support with a like and follow me for next analysis :)
Write your comment and opinion below to me

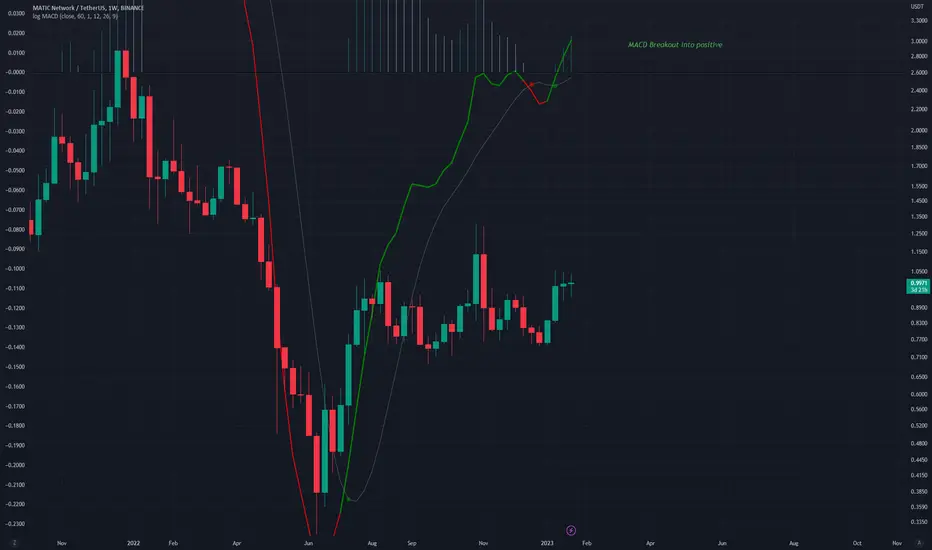
MATIC USDT WeeklyWhen you Look at the MATIC LOG Weekly chart, seriously, what is not to like about this.
This is one coin that has shown so much positives, even during the Bear.
Weekly MACD is now at 0, leaving room for further upside, however, MACD is overbought on lower TimeFrames so range or Dip likely. Also hit underside of 0.382 fib line and has yet to break above it.
This cold be an excellent Buying opportunity

Matic usdt WeeklyBINANCE:MATICUSDT
In the weekly time frame, it seems to be breaking the bullish flag pattern. The targets are clear on the chart.

MATIC bullish target1.0900 is target on maticusd H4 chart. Also this level good for sell limit order...

Matic updateWhat Is Polygon (MATIC)?
Polygon (previously Matic Network) is the first well-structured, easy-to-use platform for Ethereum scaling and infrastructure development. Its core component is Polygon SDK, a modular, flexible framework that supports building multiple types of applications.

MATICUSD - MACD BreakoutShowing the MACD on the main chart
The indicator slightly dipped before the positive area but quickly climbed back into the positive area. This is a bullish sign.
This strong stance from the indicator is also supported by price, with a sort of bullflag forming along this area of low volatility
Matic Price Analysis 4 HOUR CHART Hello and thanks for taking a look!
So here we see that Matic is coming up to a very important/ STRONG resistance LVL that NEEDS to be switched to SUPPORT IF the COIN wants to head up Higher to the upside.
We must get above the 1.0354 LVl. Then a possible target could be around the 1.123 LVL
ON THE FLIPSIDE
If we can't break this RESISTANCE We could see the coin drop back down to test the .97 - .92 LVLS AND lower.
This is just my simple quick opinion on the coin :)
HAVE an AMAZING day out there guys!

MATICUSDT SHORT TRADEHere you can see that "MATICUSDT" in 1 hour time frame has a trendline ressistance at the zone of "0.9972" and if the price shoots up till there we can get a good short opportunity.
ENJOY!!!!!!!!!!!

🔥 MATIC IS GOING TO BREAK $1 KEY LEVEL!🔥 Hi friends! The value area is a place where the whales accumulate/distribute their positions. Now MATIC is consolidainge inside the HUGE value area and I think it's an accumulation.
🚩The price of this altcoin should skyrocketing when it break the top boundary of this area ($0.96). So this is a main reason to open our longs before it happen and make a good profit.
📊 THE TRADING PLAN FOR MATIC:
1. squeeze to the trendline after the pullback
2. the huge buy orders on DOM and Footprint sclaping tools before the breakout
3. bullish BTC is a must have for the 99% of altcoins growth
🚩 The huge volume confirm the liquidation of the overleveraged long traders. It's force me to think that the recovery is possible even in a short term.
✅ MY TARGETS FOR MATIC:
🔥 $1 - key level and even number
🔥 $1.16 - key level and local high
🔥 $1.3 - key level and local high
Traders, I recommend you to book at least 30% of profit when the price reach each of our targets. Make a money and stay tuned!
💻Friends, press the "boost"🚀 button, write comments and share with your friends - it will be the best THANK YOU.
P.S. Personally, I open an entry if the price shows it according to my strategy.
Always do your analysis before making a trade

MATIC - Long scenarioThere are possible scenarios for matic to move upward.
targets are on the chart and keep in mind that any position you open, should have stoploss on 0.7. design your position with this SL and a good risk/reward.
in the green zone, we might have very low momentum, but as daily MACD gets above 0, it will jump.
all the idea will expire after getting lower than 0.7

Matic could flyMATIC forming inverse head and sholder patern which means posible leg up.
Lets see, good luck!

MATIC NETWORK SHORT TRADEHere you can see that in 1 hour time frame the "MATICUSDT" has a trendline support and the major resistance zone at "1.0298". And you look for a good SHORT TRADE here if the candle takes rejection from the point.
ENTRY - "1.0278"
TARGET - "0.9894"
STOPLOSS - "1.0434"
ENJOY!!!

MATIC- Day Trade Hi,
Short term bull move on the Matic/USDT pair. Broke above minor support and now consolidating before the next move higher. If BTC can push up slightly more I believe that will be the catalyst for the next 10% move towards $1.12-1.15.
Oh...and its in a bullish pennant which every newbie trader loves to trade!
GL if you join

MATCICUSDTWyckoff distribution evident on Matic.
Target 81 cents
This invalidates my previous long idea.


MATICUSDT1.25 is very possible on Matic as it completes wave 5.
Looks like will retest resistance at 1.05 and break it.

MATICUSDT, key zones to watch and next moveHello guys, Everything is explained on the chart for you like always. Matic is below a strong resistance zone for now but has the potential to break it. Possible and expected next move and targets are explained to you. The targets will be 1.3 and 1.7 .
Good luck.
If you like the idea, do not forget to support with a like and follow me for next analysis :)
Write your comment and opinion below to me

Inverse head and shoulderAn inverse H& S pattern is forming on daily time frame. All depends on completion and successful breakout from neckline.
**Warning** A crash much worst then covid 19 crash of 2020 can strike market anytime from now to next few weeks.
You can follow me for more ideas and updates.

MATIC / USDT 1D chart Resistance and SupportNow we will check the situation on the MATIC chart in pair to USDT, also on a one-day interval. at the beginning, let's mark with a white line, the main downtrend line, however, we can see that the price has broken the local downtrend line.
Now let's move on to checking where we currently have support for the price. And here we see that we first have a support zone from $0.93 to $0.81, if the price goes lower then the next support is at $0.70 and then $0.53.
Looking the other way, we can see that the price has bounced off an important resistance at $1.04, then there is resistance at $1.20 and $1.45.
Now look at the CHOP index, which indicates that the energy is starting to rise, MACD indicates that despite the correction, we are maintaining an upward trend, while the RSI shows a nice rebound, thanks to which we have a new place for growth.
