matic/usdt by khalid osman best support and r for next 2 year im not waiting a line to test twise and drow a line to smart mony do a liq grab on me in 3 time i have a secret i can drow ghost support and re also im all in in those price
MATICUSDT

MATIC / USDT 1D chart Resistance and SupportHello everyone, I invite you to review the MATIC chart in pair to USDT also on a one-day timeframe. As the first we will mark the downtrend lines in blue and with the yellow line the local downtrend line. Both of these lines were broken by the price.
First, we will check the situation with the resistances that the price must overcome and here we see that we have the first resistance at $0.81, the second at $0.69, the third at $0.53 and the fourth at $0.32.
Looking the other way, the same with the Fib Retracement tool we will check what support we should take into account, so the first support that the price is currently fighting is $ 0.93, if we manage to break it, we have the second at $ 1.31, the third at $ 1.63 and the fourth support at $1.93.
Looking at the CHOP index, we see that the energy is gaining more and more strength, the MACD indicator indicates that we have entered an uptrend, while the volume is increasing, with buyers predominating.

Polygon Remains One Of The Strongest ... (111%+ Possible)Polygon (MATICUSDT) has been really strong ever since the June 2022 low and is setting itself up once again for fast growth.
With the current chart we have on screen, we can project a mid-term target of 115%+ growth potential, even possible in the short-term.
That's because we have higher lows and massive strength shown when the correction took place. Prices stayed above the .618 Fib. retracement level.
The easy target can be seen around $1.14 and $1.25.
The main target can be set around $1.85.
It is a bit far off, but once the Altcoins start moving, they tend to do so fast and strong.
No doubt about that, that's why we like crypto...
Endless opportunities and massive potential for growth.
Namaste.

short MATIC$MATIC bounced off the resistance level. Decline to support level at 0.8202$ is possible.

$ATOMUSDT UPDATE!!!Hi Snipers,
Please refer to the recording for the next price levels and scenarios.
Thanks
MS

Polygon MATIC price Medium and Long term tradeThe MaticUSDT price was one of the first to break out of the falling trend channel back in July this year.
Now MaticUSD is trading above the liquidity zone of $0.67 - 0.77
You can try a medium-term trade:
Entry $0.831
Stop $0.7624 (-8%)
Take profit $1.1974 (+44%)
Profit/loss ratio 5/1
You can also consider this trade as a long-term investment and hold it until the take profit of $1.90 (+127%)
You can also keep a larger stop on the position, around $0.67
There are many options, it depends on what parameters your risk and money management allows .
But it is probably not worth getting the Polygon token - Matic when the price will be below $0.67 . After all, there is an "emptiness" below the liquidity zone and the possibility of the MaticUSDT price collapsing to around $0.4
_____________________
Did you like our analysis? Leave a comment, like, and follow to get more

Matic Trading Range in 1Hhi every one
Matic is in a trading range, its perfect for short-term trades ,
watch and make your decision,
my decision: I prefer to short here
please share your opinion in the comments
I consider all analyses performed in relation to that trade position.
Our analysis is not a buy or sell referral.
If you found our analysis valuable and interesting, feel free to share it so that more individuals might benefit from it.
And please don't forget to like and comment; we will read them all.

Matic zones based on previous BTC ideahi guys, Matic has always been a great investment even when other coins in the market are not healthy.
but this time, please decide wisely as some major drops are also possible.
support zones are shown in the chart. the blue line is the pivot. All my bearish idea will be expired if the price goes above the pivot.
leave out your opinion in the comment section below

CRYPTO MARKET UPDATE!!! MOON OR BLOOD?Hi Snipers,
Please refer to the recording for the next price levels and scenarios.
Thanks
MS


Matic - Good Opportunity
MATICUSDT :
is on a Good opportunity for sell or buy.
but in my opinion , long side have better chance.
if price can break YELLOW area and hold , you can enter to a good long position.
if price can break RED area and hold , you can enter to a good long position.
Keep an eye on it.

MATIC / USDT 1D chart Targets and StoplossHello everyone, let's look at the 1D MATIC to USDT chart. As you can see, the price is moving above the local downtrend line.
Let's start by setting goals for the near future that we can take into account:
T1 = $0.9158
T2 = $0.9619
T3 = $1.0112
T4 = $1.0759
and
T5 = $1.1616
Now let's move on to the stop loss in case the market goes down further:
SL1 = $0.8502
SL2 = $0.7964
SL3 = $0.7643
SL4 = $0.7393
and
SL5 = $0.6911
Looking at the CHOP indicator, we see that there is still a lot of energy for the next move on the 1D interval, while the MACD indicator indicates a downtrend.

MATIC's price fluctuated between the res and sup!MATIC had a range trend during the last week. The price of this currency fluctuated between the resistance and support levels that were intended for it. After the selling pressure pushed the price of MATIC to the support range of 0.750 to 0.790 dollars, a positive reaction and increased demand were observed in the MATIC trend. Also, from above, the resistance that was considered in the range of 0.890 to 0.950 dollars has been associated with a negative reaction. Therefore, the range area is completely clear.
As long as the buyers cannot return the price above the current resistance, the downward trend is expected to continue in the higher timeframe. One of the main and important resistances of MATIC is the price of $1 and also the range of $1 to $1.07, which we expect a negative reaction if the price hits this area. Also, one of the most important support levels of MATIC is considered at the price of 0.62-0.66 dollars, which has not yet been priced at this pullback level. So it can be associated with a good reaction. The price is barely above the Ichimoku cloud.

Polygon (MATIC) - November 26Hello?
Traders, welcome.
If you "Follow", you can always get new information quickly.
Please also click "Boost".
Have a good day.
-------------------------------------
(MATICBTC 1W chart)
It is showing a tendency to decline from the high point range of 0.0000 5049 to 0.0000 5393.
If there is a sharp downtrend when it drops below 0.0000 5049, there is a possibility that it will touch the next support range, 0.0000 2954 ~ 0.0000 3337.
However, we must not forget that it has an upward force until it falls below 0.0000 2954.
--------------------------------------
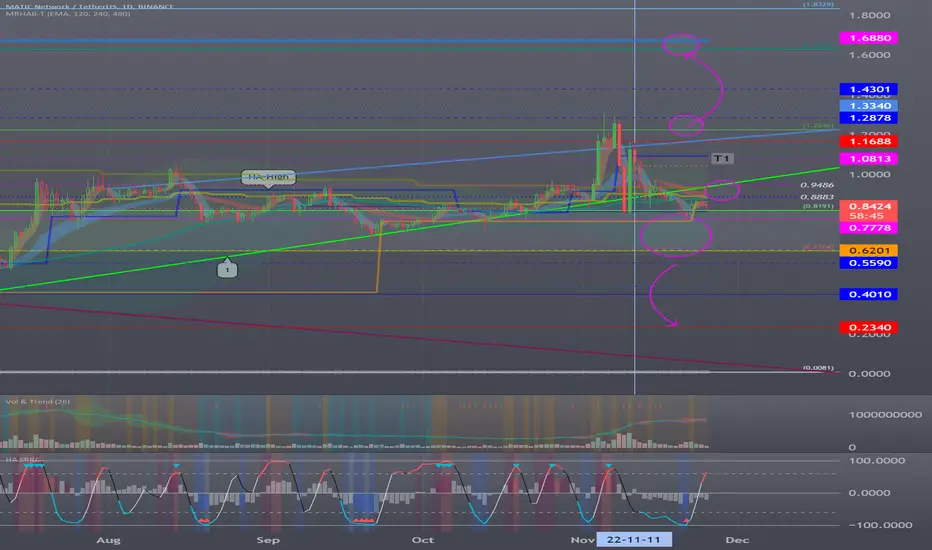
(MATICUSDT 1W chart)
The 0.6164-0.8191 interval is the one that determines the trend.
Therefore, it is important to be able to climb with support in this section.
If it fails to get support, if it falls below 0.5590, it is likely to take a plunge, so be careful.
(1D chart)
The question is whether the price can sustain itself by moving up to or above the 0.8883-0.9486 range.
If not, you should check for support in the 0.6164-0.8191 interval.
A rise to the 0.8883-0.9486 zone is expected to lead to a move towards the 1.0813 area.
-------------------------------------------------- -------------------------------------------
** All descriptions are for reference only and do not guarantee profit or loss in investment.
** If you share this chart, you can use the indicators normally.
** The MRHAB-T indicator includes indicators that indicate points of support and resistance.
** SR_R_C indicators are displayed as StochRSI (line), RSI (columns), and CCI (bgcolor).
** The CCI indicator is displayed in the overbought section (CCI > +100) and oversold section (CCI < -100).
(Short-term Stop Loss can be said to be a point where profit or loss can be preserved or additional entry can be made by split trading. This is a short-term investment perspective.)
---------------------------------
Ichimoku Analysis for MATICClosing below the cloud and also lagging below it will be a good short signal.

MATIC technical analysisPrice is ranging between the support around $0.84 and the 4h supply around $0.88. We shall wait for the breakout for confirmation but overall price will either break below the support and reach the 4h demand around $0.81, or it will break above the supply and reach the next supply at $0.83.

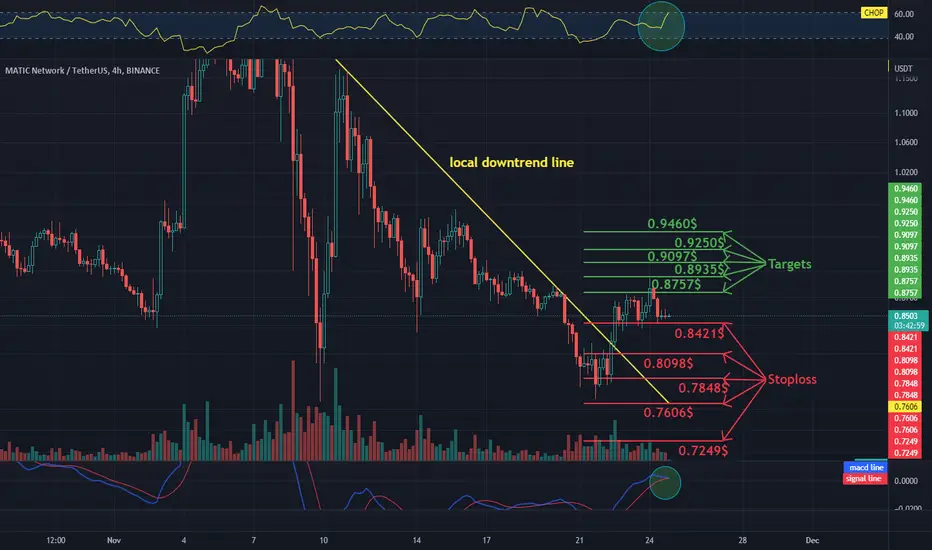
MATIC / USDT 4H chart Targets and StoplossHello everyone, let's look at the 4H MATIC to USDT chart as you can see that the price is moving above the local downtrend line.
Let's start by setting goals for the near future that we can take into account:
T1 = $0.8757
T2 = $0.8935
T3 = $0.9097
T4 = $0.9250
and
T5 =0.9460$
Now let's move on to the stop loss in case the market goes down further:
SL1 = $0.8421
SL2 = $0.8098
SL3 = $0.7848
SL4 = $0.7606
and
SL5 = $0.7249
Looking at the CHOP indicator, we see that the energy is heavily charged on the 4H time frame, the MACD indicator shows that it is in a local uptrend, while the volume is very low.
MATIC Cup and handle BULLISH!Hi, Tradingview
BINANCE:MATICUSDT
MATIC has formed a cup and handle on the 2hr, and 4hr chart. We can also see with the TSI indicator that there is what looks like a bullish
crossing possibly happening on the 2hr, however possible bearish crossing on 4hr. This means it could go either way. We could see a bounce
on the 4 hour with a break on the 2 hour(bullish), or a bounce on the 2 hour with a break on the 4 hour(bearish). I will be waiting for
confirmation of either before I get into a trade (details below). Before we get into that I want to discus what could happen if the bearish
crossing on the 4 hour takes place. 1. We could see a test of the .85, or .83 support (yelllow dashed lines) 2. we could see a complete
breakdown of the cup and handle. Breaks downs like that have been occuring recently. I personally am leaning more towards the bullish side
as I believe the rest of the market is.
How I would trade this (will update if I take a position)
Entry: Break and confirmation of red box, retest of .8535 support with bullish TSI
SL: break below red box
TP1: .89
TP2: .90
TP3: .95
Hoping to see some more bullish action. Happy trading!
-- Spike Cap

#MATIC/USDT Trade Setup 54% Potential Pump. RR 1:9Welcome to this quick trade setup, everyone!
Recent trades posted:-
1. BTC /USDT (Running in Profit)
2. ETH/USDT (Running in Profit)
3. CHZ/USDT (In Accumulation)
4. CHR/USDT (Running in Profit)
5. MATIC/USDT (In Accumulation)
Entry:- $0.8075 TO $0.8611
(6.22% is the accumulation range from CMP so plan your entry accordingly)
Stop Loss:- $0.7576
Recommended Leverage:- 3x- 5x
Target:- Open (Possibly 35% to 54%)
RR 1:9 (Highly Lucrative)
This is not financial advice. Always DYOR.
These are my trades.
Do not cry in the comments if you can't afford the Stop Loss or go for 125x gambling.
I am ready to take the SL if it gets hit.
Trade only if you can afford the SL.
Do the maths before you enter the trades and manage your risks properly.
Fund preservation is our foremost priority.
If you like me to post more please share this idea with your friends and communities and hit the like button.
I have been with you in the bullish days and the bearish days.
We are going to have an amazing bull run for sure.
Cheers!
Thank you
#PEACE

Maticusdt show NEUTRAL Ascending TriangleMaticusdt show NEUTRAL Ascending Triangle
More probability going down.

MATIC technical analysisPrice filled the imbalance around $0.86 and it is currently moving down from there. I still expect price to tap into the 4h supply around $0.87 before potentially moving down again.

MATIC ready to break down due to unforeseen technicalsThis is a very tough analysis to do as there was an anomaly of an event which shifted the technical analysis dynamics.
I guess right now the price is sideways with bearish signals for further downside.
Once we have price below the 200MA and below the support around $0.7600 it's likely for the price to continue down to $0.2550.
With the crypto-winter, lack of confidence with exchanges, regulations and finances - I wouldn't be surprised to see further downside for Altcoins like MATIC.
Bearish bias.

Trading opportunity for MATICUSDT PolygonBased on technical factors there is a Buy position in :
📊 MATICUSDT Polygon
🔵 Buy Now 0.8477
🧯 Stop loss 0.7908
🏹 Target 1 0.8990
🏹 Target 2 0.9900
🏹 Target 3 1.1440
💸RISK : 1%
We hope it is profitable for you ❤️
Please support our activity with your likes👍 and comments📝
