maticusdtI took a scalp position on matic coin. There is a nice flag formation. I won't be alarmed if it does throwback. I never enter a trade without a stop. I always keep an eye on btc.. Good luck.. Please respect the effort and support my page
Maticusdtlong

MATICUSDT trade will go for 800%MATICUSDT will be in the range before it will heads up. You can enter around 0.2-0.7 level for long term investment to get 800%. For short term trade pathway has been shown by arrow. Good luck

MATIC/USDT_DIn a huge channel and looks possible huge inverse head & shoulders then ready for action
- NFA -

MATIC BREAKOUT THE RESISTANCE!!TRADING SUGGESTION:
Now we looking to the market got continue bullish form,so take a buy trade,GOOD LUCK
.
.
.
.
TAKE A TRADE,SIT BACK AND RELAX
LIKE AND SHARE

MATICUSDT Resistance BreakoutMATICUSDT Technical analysis Update
MATIC/USDT currently trading at $1.139
Resistance Breakout
Buy level: $1.133 -$1.146
Stop loss: $1.095
TP1: $1.178
TP2: $1.226
TP3: $1.25
TP4: $1.30
Max Leverage 2x
Always keep Stop loss
Note: please do your own research before investing. Never invest money that you can't afford to lose.

Long MaticLooks like the ABC Correction wave has been finished and RSI 50 is acting as a strong support as it has been for quite some time now, we can see that EMA 200 has also acted as a strong support, probably will be seeing a few days to a week bullish days if there is no major changes in BTC structure.

MATIC Is About to MOONWe are currently breaking thru the golden pocket of resistance that has been holding MATIC back from pumping hard. Not long ago MATIC was $2.70 - right now it's less than 50% off. That $1.04 price tag will not last long. Load up your bags


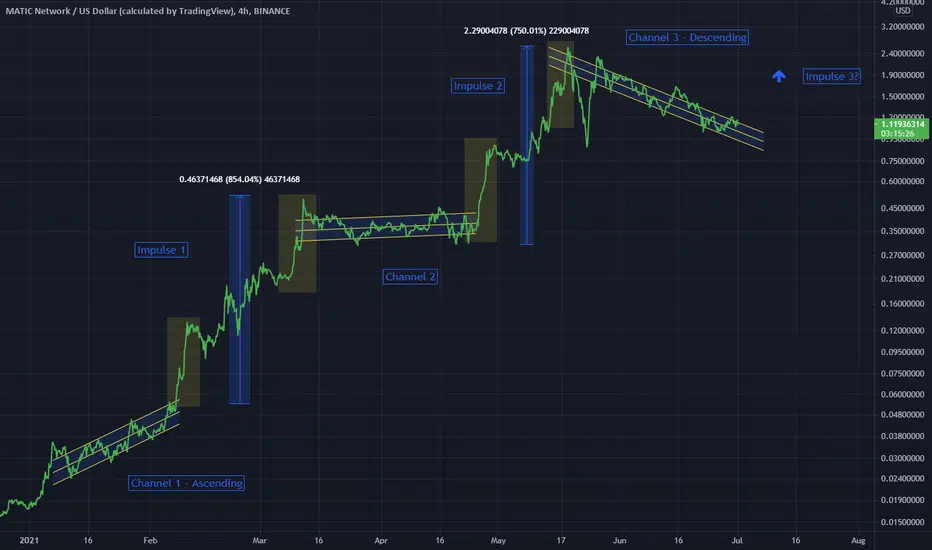
MATIC 4Hr IdeaIdea for MATICUSD
making assumptions on the nature of price movements after channels complete
this current channel is descending, and is possibly a good entry point for a large move
As suggested by the previous channels
As the timeframes get lower the risk/difficulty raises, so take this into account
MATICUSDT (4H CHART) - Trend BreakoutMATICUSDT (4H CHART) Technical Analysis Update
MATICUSDT (4H CHART) currently trading at $1.442
Buy level: Above $1.224
Stop loss: Below $0.995
Target 1: $1.232
Target 2: $1.429
Max Leverage: 3X
ALWAYS KEEP STOP LOSS...
Follow Our Tradingview Account for More Technical Analysis Updates, | Like, Share and Comment Your thoughts.

💥MATICUSD - TO SHORT TO $1.48 AND LONG TO $1.92Right here is an inverted head and shoulder pattern.
This pattern is an idea of what MATIC price layout is currently doing. There's a neckline at $1.73 serves as a major resistance for price to break to confirm a good buy to $1.92.
As price is unable to break this neckline, I expect price to fall to $1.48 to form the right shoulder before rising back to the neckline at $1.73.
If price is so fortunate to break this neckline, then we are certain of a good buy to $1.92.
What do you think?
Share your opinion in the comment section✍️
Please support this idea with a LIKE👍 if you find it useful🥳
Follow me to receive more updates on this pair🤙
Comment any coin you need my analysis or forecast on📈📉
Happy Trading💰🥳🤗
Thank you for your support!💓

MATICUSDT | V-Shap Recover | Falling Wedge BreakoutMATICUSDT | V-Shap Recover | Falling Wedge Breakout
MATIC After V-Shap Recover went into a long correction phase and created a Bullish Reversal Pattern (Falling Wedge). MATIC has potentially broken the wedge and then retested the broken zone.
It seems that MATIC has completed the correction phase and ready for a bull rally.
NOTE: DO YOUR OWN ANALYSIS. DO PROPER RISK AND MONEY MANAGEMENT. SPOT TRADING ONLY.
Buying Above: 1.55766
TP1: 1.90588
TP2: 2.32419
TP3: 2.69442
SL: 1.16667

MATICUSDT Technical Analysis
Happy Monday guys, I'm here with another Signal
MATICUSDT has broken above a major Resistance and now it's ranging. because of the big Green candle I think it's gonna go higher how ever it might Pullback to 1.3 before it rises. So we need be cautious to see the price action.
Buy now or Buy at 1.300
SL @ 1.23
TP1 @ 1.5
TP2 @ 1.67
Happy Trading :)
If you find this helpful and want more FREE forecasts in TradingView
Please show your support back,
Hit the 👍 LIKE button,
Drop some feedback below in the comment!
❤️ Your Support is very Really appreciated!❤️

The last MATIC Green Dot this low On the daily time frame was back on November 4th, 2020 when MATIC was at $0.04 - it was also coupled with a bullish stoch RSI cross and the normal RSI pointing up, both of which are present here. This is a huge buy signal !

MATIC About to Pump HardHuuuuge green dot on the 12 hour - haven't seen one of these in a long time. Load em up!

MATIC TO 5$ (MIN) THIS MARKET CYCLEI TRULY BELIEVE POLYGON (MATIC) HAS STRONG FUNDAMENTALS, PLUS SOME TECHNICALS ARE STRONGLY BULLISH THAT IT WILL REACH EASILY 5$ IF NOT BEYOND. WE ARE JUST SPEAKING OF A 35BLN MARKET CAP WHICH IS PERFECTLY ACHIEVABLE.
TRADE RESPONSIBLY, NOT FINANCIAL ADVICE.


Read this before buying MATIC (Eduction Post) Here is the analysis of MATIC. MATIC is rejected from the resistance zone and also from the uptrend channel upper line resistance. MATIC broke the uptrend channel in the downward direction. MATIC is near all-time and increased drastically in the last few months. Also if you see the market cap it is $12 Billion and MATIC rank is 10 among all cryptocurrencies. So the upward potential is low because of the high market cap. We did not suggest you to open a long position in MATIC here. If you have MATIC already hold with stop loss. Let it come down and stable in a range for accumulation. The support zone for MATIC is $1.75-$1.85 and if broken we see more downside movement.
#No financial advice

MATIC Giant Bullflag Target $2.08 TargetPotential Level 2 Scaling Solution for ETH. Watch this one in the coming days

MATICUSDT Possible Bullish Scenario !!Possible Bullish Scenario if price manages to stay above the trend line .

💥MATICUSD - UPWARD BREAKOUT TO $1.75, $2.43 OR SHORT TO $0.80As we can see on this chart, price is in a breaking point. Therefore I expect MATIC to either breakout upward to $1.75, then $2.43 or breakout downward to $0.80.
The yellow horizontal lines are potential price target price has to break to continue in it's trend.
What do you think?
Share your opinion in the comment section✍️
Please support this idea with a LIKE👍 if you find it useful🥳
Also, kindly cheer me with coins if you like my work.
Follow me to receive more updates on this pair🤙
Happy Trading💰🥳🤗
Trading Involves High Risk⚠️
Not Financial Advice💸
Use Proper Risk Management💹
Thank you for your support!💓
NB: If you have any question for me or you would like to learn forex trading, improve on your technical analysis skills, DM me.

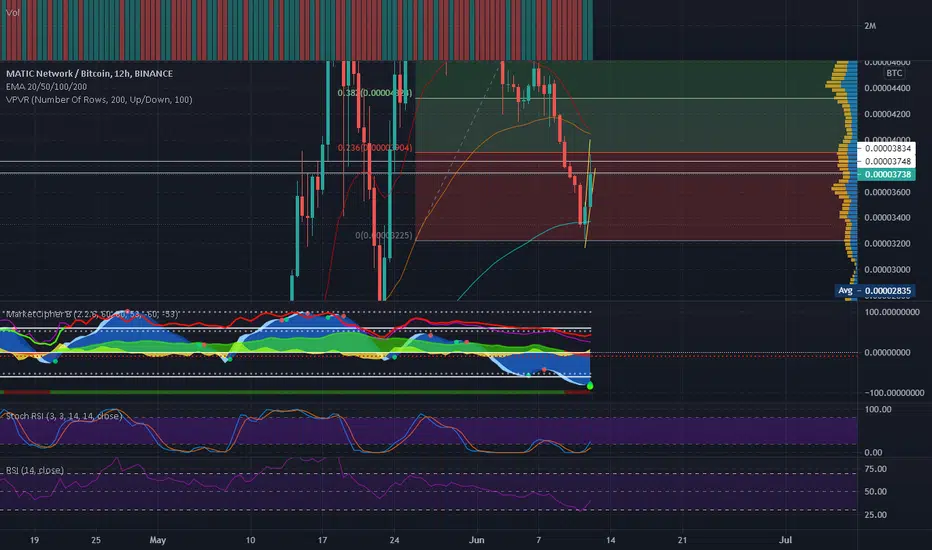
Polygon (MATIC) Bearish Below Major TrendlinePrice is currently sitting under a major trendline that has formed
The structure that has formed under looks to lack momentum to break this trendline
Some cool symmetry within the fib circle and price can be seen within the oval (a) Both arising from a base (rectangle) formation
I wouldn't enter this unless you believe in the project and foresee its future as bright
I would wait for a better entry
