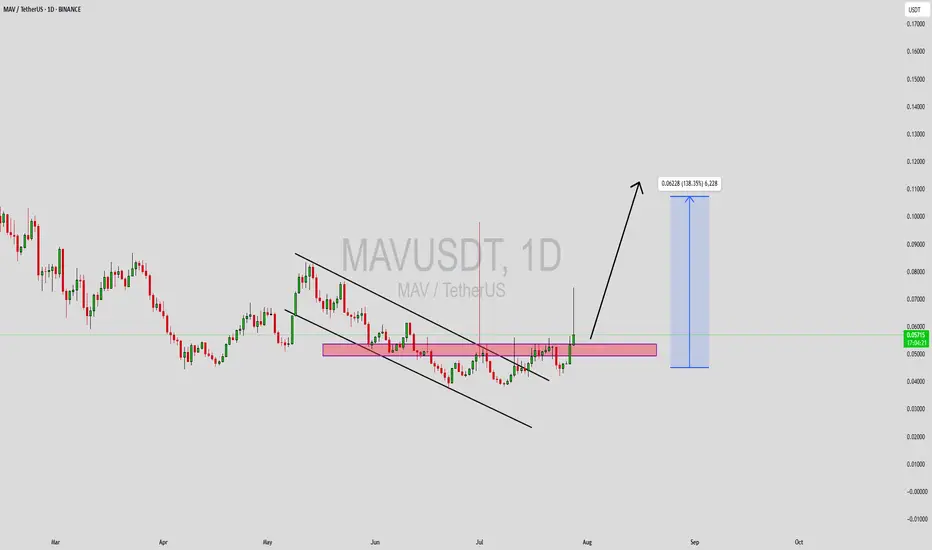
MAVUSDT Forming Falling ChannelMAVUSDT has recently broken out of a falling channel pattern, signaling a potential trend reversal from its prolonged downtrend. This breakout is supported by a noticeable surge in trading volume, adding strength to the bullish momentum. The chart shows that price has successfully retested the previous resistance zone, now acting as strong support. This structural shift provides a compelling setup for an explosive upward move, especially as momentum builds across the altcoin market.
Traders are closely watching MAV due to its technical setup, as well as the broader interest in decentralized finance (DeFi) protocols. The current price action hints at a high-probability bullish continuation, with a projected gain of 90% to 100%+ if bullish sentiment remains intact. The combination of solid support formation, high-volume breakout, and clear upside potential makes this a high-conviction play among smart money participants.
Maverick Protocol (MAV) is gaining attention for its unique approach to liquidity provisioning in DeFi. As the ecosystem matures and more investors look for efficient capital deployment strategies, protocols like MAV stand to benefit. The fundamentals, combined with the technical picture, suggest that the current levels may represent a key accumulation zone before a major breakout.
This setup could offer significant upside for early movers. Watching for follow-through candles and sustained volume above breakout zones will be key to validating the strength of this breakout move.
✅ Show your support by hitting the like button and
✅ Leaving a comment below! (What is You opinion about this Coin)
Your feedback and engagement keep me inspired to share more insightful market analysis with you!
Mavusdtlong
MAVUSDT Forming Bullish ReversalMAVUSDT is currently showing strong technical signs that have caught the attention of traders who are searching for the next breakout altcoin. This crypto pair is moving within a clear downward channel, which often sets the stage for a significant bullish reversal once the price breaks out convincingly. Combined with good volume, this indicates healthy market participation and interest, a key factor for sustainable upward momentum.
Many investors are eyeing MAVUSDT because the expected gain is projected between 40% to 50%+, a realistic target considering its price structure and historical volatility. The recent price action shows that buyers are stepping in near key support levels, which adds to the conviction that a breakout could push prices higher. The confluence of a well-defined pattern, solid volume, and growing investor sentiment makes MAVUSDT an attractive setup for swing traders and medium-term investors.
Additionally, MAVUSDT aligns well with the broader crypto market recovery trend, which has seen altcoins reclaiming lost ground. As traders hunt for high-potential coins with clear technical setups, MAVUSDT stands out for its ability to deliver consistent price swings. Watching the breakout levels and monitoring daily closes will be crucial to confirm the move and manage risk properly.
In summary, MAVUSDT is worth keeping on your radar for its clear technical pattern, solid volume profile, and potential to deliver a strong upside move in the coming sessions. Stay alert for a confirmed breakout to capture the best part of this anticipated run.
✅ Show your support by hitting the like button and
✅ Leaving a comment below! (What is You opinion about this Coin)
Your feedback and engagement keep me inspired to share more insightful market analysis with you!

MAVUSDT – Critical Resistance Zone AheadThe blue box is a key resistance area where smart money could be looking to sell. This is not a place to FOMO in blindly. If price rejects here with volume-backed selling pressure and LTF breakdowns, it could be an ideal short opportunity.
📌 How to Trade This Like a Pro?
✅ Patience Wins – Let the market show its hand. If we see a rejection, we execute.
✅ No Confirmation = No Trade – CDV weakness, low-timeframe breaks, and volume shifts are our green light.
✅ Breakout & Retest? Flip the Bias – If price smashes through with volume and retests, we adapt and look for longs.
Discipline = Profits. The difference between professionals and amateurs is knowing when to strike and when to wait. Follow the plan, or follow the crowd, your choice.
📌I keep my charts clean and simple because I believe clarity leads to better decisions.
📌My approach is built on years of experience and a solid track record. I don’t claim to know it all but I’m confident in my ability to spot high-probability setups.
📌If you would like to learn how to use the heatmap, cumulative volume delta and volume footprint techniques that I use below to determine very accurate demand regions, you can send me a private message. I help anyone who wants it completely free of charge.
🔑I have a long list of my proven technique below:
🎯 ZENUSDT.P: Patience & Profitability | %230 Reaction from the Sniper Entry
🐶 DOGEUSDT.P: Next Move
🎨 RENDERUSDT.P: Opportunity of the Month
💎 ETHUSDT.P: Where to Retrace
🟢 BNBUSDT.P: Potential Surge
📊 BTC Dominance: Reaction Zone
🌊 WAVESUSDT.P: Demand Zone Potential
🟣 UNIUSDT.P: Long-Term Trade
🔵 XRPUSDT.P: Entry Zones
🔗 LINKUSDT.P: Follow The River
📈 BTCUSDT.P: Two Key Demand Zones
🟩 POLUSDT: Bullish Momentum
🌟 PENDLEUSDT.P: Where Opportunity Meets Precision
🔥 BTCUSDT.P: Liquidation of Highly Leveraged Longs
🌊 SOLUSDT.P: SOL's Dip - Your Opportunity
🐸 1000PEPEUSDT.P: Prime Bounce Zone Unlocked
🚀 ETHUSDT.P: Set to Explode - Don't Miss This Game Changer
🤖 IQUSDT: Smart Plan
⚡️ PONDUSDT: A Trade Not Taken Is Better Than a Losing One
💼 STMXUSDT: 2 Buying Areas
🐢 TURBOUSDT: Buy Zones and Buyer Presence
🌍 ICPUSDT.P: Massive Upside Potential | Check the Trade Update For Seeing Results
🟠 IDEXUSDT: Spot Buy Area | %26 Profit if You Trade with MSB
📌 USUALUSDT: Buyers Are Active + %70 Profit in Total
🌟 FORTHUSDT: Sniper Entry +%26 Reaction
🐳 QKCUSDT: Sniper Entry +%57 Reaction
📊 BTC.D: Retest of Key Area Highly Likely
📊 XNOUSDT %80 Reaction with a Simple Blue Box!
📊 BELUSDT Amazing %120 Reaction!
I stopped adding to the list because it's kinda tiring to add 5-10 charts in every move but you can check my profile and see that it goes on..

MAVUSDT 4DMAV ~ 4D Analysis
#MAV Buy gradually from here if you still have a Conviction on this Coin. with a short -term target of at least 15%+.

MAVUSDT 3DMAV ~ 3D
#MAV If you still have Conviction on the coin,. This support block would be a very good buying place for now.

MAVUSDT Long Setup!MAVUSDT technical analysis update
MAV price is breaking out of its triangle pattern on the 4-hour chart; we can expect a 30-50% move from the current level.
Buy zone : Below $0.375
Stop loss : $0.337
Regards
Thanks

Maverick Protocol (MAV) completed a setup for upto 26% pumpHi dear friends, hope you are well and welcome to the new trade setup of Maverick Protocol (MAV) with US Dollar pair.
Recently we caught almost 27% pump of MAV as below:
Now on a 4-hr time frame, MAV has formed a bullish BAT move for the next price reversal move.
Note: Above idea is for educational purpose only. It is advised to diversify and strictly follow the stop loss, and don't get stuck with trade.

Maverick Protocol MAV Coin PRICE PREDICTION🔥 Price on the 4H chart might come at these support area and we might get a potential bounce🔥
Potential bounce areas for Buying 0.3821 and 0.3009
👉 Follow me for more real time opportunities.
Share your Thoughts if you have any?

MAVUSDT Good Buy!MAVUSDT Technical Analysis Update
MAVUSDT Price broke its resistance zone with high volume, we can expect a bullish continuation in MAV.
Buy zone : Below $0:319
Stop loss : $0.284
Always Keep Stop Loss
Thanks
Hexa

MAV/USDT - Maverick Protocol: BBand_Breakout◳◱ A Bollinger Band breakout has been identified on the NYSE:MAV / CRYPTOCAP:USDT chart, as the price has breached the upper Bollinger Band. This occurrence suggests the emergence of a potential bullish trend. Noteworthy resistance levels can be observed at 0.2429 | 0.2621 | 0.3038, while significant support zones are located at 0.2012 | 0.1787 | 0.137. It is advisable to contemplate initiating a buy position within the present price range of 0.2465 with the objective of attaining higher price levels.
◰◲ General info :
▣ Name: Maverick Protocol
▣ Rank: 359
▣ Exchanges: Binance, Kucoin, Bybit, Mexc
▣ Category/Sector: N/A
▣ Overview: Maverick Protocol project overview is currently unavailable. I'll try to update this in the upcoming analysis.
◰◲ Technical Metrics :
▣ Mrkt Price: 0.2465 ₮
▣ 24HVol: 7,021,848.372 ₮
▣ 24H Chng: 10.192%
▣ 7-Days Chng: 13.30%
▣ 1-Month Chng: 11.16%
▣ 3-Months Chng: -20.39%
◲◰ Pivot Points - Levels :
◥ Resistance: 0.2429 | 0.2621 | 0.3038
◢ Support: 0.2012 | 0.1787 | 0.137
◱◳ Indicators recommendation :
▣ Oscillators: SELL
▣ Moving Averages: STRONG_BUY
◰◲ Technical Indicators Summary : BUY
◲◰ Sharpe Ratios :
▣ Last 30D: -0.23
▣ Last 90D: -0.61
▣ Last 1-Y: 0.00
▣ Last 3-Y: N/A
◲◰ Volatility :
▣ Last 30D: 0.81
▣ Last 90D: 0.94
▣ Last 1-Y: 1.05
▣ Last 3-Y: N/A
◳◰ Market Sentiment Index :
▣ News sentiment score is N/A
▣ Twitter sentiment score is N/A
▣ Reddit sentiment score is N/A
▣ In-depth MAVUSDT technical analysis on Tradingview TA page
▣ What do you think of this analysis? Share your insights and let's discuss in the comments below. Your like, follow and support would be greatly appreciated!
◲ Disclaimer
Please note that the information and publications provided are for informational purposes only and should not be construed as financial, investment, trading, or any other type of advice or recommendation. We encourage you to conduct your own research and consult with a qualified professional before making any financial decisions. The use of the information provided is solely at your own risk.
▣ Welcome to the home of charting big: TradingView
Benefit from a ton of financial analysis features, instruments and data. Have a look around, and if you do choose to go with an upgraded plan, you'll get up to $30.
Discover it here - affiliate link -

MAV/USDT bullish ride? 👀 🚀 MAV Today Analysis
💎 Paradisers, set your sights on MAVUSDT as it positions itself within a demand zone, firmly anchored at a pivotal support, and gears up for a potential bullish surge.
💎 A retrospective glance reveals that MAV faced resistance at the 0.3054 mark, having approached this threshold twice. After these encounters, it underwent a liquidity-driven descent. However, post this dip, MAV seems to be regaining its bullish stride, and our analysis suggests a strong likelihood of the asset challenging the resistance once more in the near horizon.
💎 On the flip side, should MAV breach the confines of the demand zone, brace for a bearish trajectory, with the asset possibly seeking out the next support level.
💎 Remember to employ prudent trading strategies and use proper stop-loss measures! Stay alert to market movements and look forward to more insight

MAVUSDT - Resistance Breakout!MAVUSDT (1D Chart) Technical analysis
MAVUSDT (1D Chart) Currently trading at $0.275
Buy level: Above $0.270
Stop loss: Below $0.235
TP1: $0.30
TP2: $0.35
TP3: $0.42
TP4: $0.5
Max Leverage 2x
Always keep Stop loss
Follow Our Tradingview Account for More Technical Analysis Updates, | Like, Share and Comment Your thoughts

MAVUSDT Trend Line Breakout!MAVUSDT Technical analysis update
Buy zone : Below $0.235
Stop loss : $0.214
Take Profit 1 : $0.2500
Take Profit 2 : $0.295
Take Profit 3 : $0.331
Thanks
Hexa
