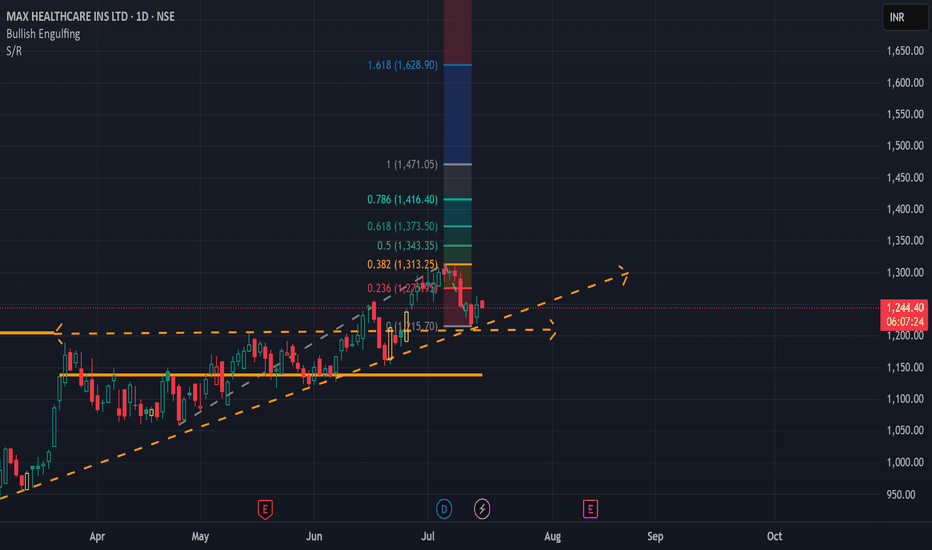
MAXHEALTH
maxhealthNSE:MAXHEALTH
One Can Enter Now ! Or Wait for Retest of the Trendline (BO) Or wait For better R:R ratio
There can be a pause or reversal, at all time high.
Note :
1.One Can Go long with a Strict SL below the Trendline or Swing Low of Daily Candle.
2. Close, should be good and Clean.
3. R:R ratio should be 1 :2 minimum
4. Plan as per your RISK appetite
Disclaimer : You are responsible for your Profits and loss, Shared for Educational purpose
#LALPATHLAB #MOREPENLAB #IPCALAB #DIVISLAB #VIMTALAB #LAURUSLABS#LALPATHLAB
NSE: LALPATHLAB
CMP: 2345
TP: 3075
SL: 2100
TF: <6m
RR > ~3 times
Return > 30%
THYROCARE CNXPHARMA LUPIN SUNPHARMA SPARC DIVISLAB DRREDDY AUROPHARMA BALPHARMA GLENMARK SANOFI PFIZER BPLPHARMA MARKSANS BIOCON GRANULES IPCALAB LAURUSLABS NATCOPHARM GLAND ALKEM ZYDUSLIFE APOLLOHOSP FORTIS AARTIDRUGS ZYDUSWELL MAXHEALTH BAJAJHCARE
Factors:
BULLISH WEDGE BREAKOUT
Trend Following
Rising Volume with rising Prices.
Flag pattern breakout.
Pennant Pattern Breakout with Bullish Candle.
Retest Successful.
Higher Highs & Higher Lows.
Broken above RESISTANCE levels
Trading at SUPPORT levels
Earnings are strong.
Bullish Wedge Breakout
Risk Return Ratio is healthy.
And
Rising from Double Bottom Pattern to Flag Pattern forming.
MAXHEALTHMAXHEALTH- It has formed descending triangle pattern. It has two possibilities. No1: If it breaks the triangle upside it will go towards the target marked.
No;2 If it breaks the triangle down side then fall will be there until its marked.
Disc: Only for learning purpose. Not trading Recommendation.
MAX HEALTHCARE - Butterfly PatternThere is a trendline breakout on both Price and RSI on the weekly chart of Max Healthcare.
There is also a probability of Butterfly Pattern on the chart and if it unfolds stock can see 430, 490, and 540 levels in the coming months.
1. Type of Trade: Positional Long Trade
2. Buy on dips
3. Price Should sustain above 330 - 350 price zone.
MAX HEalthcare Bullish Or bearish1. 1 Day: Delivery volume increased by 125.98% over 5 day average
2. 1 Month: Delivery volume increased by 29.56%
FIIs
Held by 194 FIIs (16.67%)
Mutual Funds
Held in 18 Schemes (15.58%)
Increasing Revenue every Quarter for the past 4 Quarters
Company with Low Debt
Mutual Funds have increased holdings from 8.64% to 15.58% in Dec 2021 qtr.
FII/FPI have increased holdings from 14.23% to 16.67% in Dec 2021 qtr.
Institutional Investors have increased holdings from 22.93% to 32.35% in Dec 2021 qtr.
It will form a head and shoulder pattern , its based on Probaility ans the conditions are favouring its formation , like earning coming up in the period may hit the head of the pattern and will go down . target as shown in the chart
+++++++++++++++++++++++++++
LIKE IF YOU AGREE
=======================++++
MAXHEALTH Potential Intraday/1 Week SwingMAXHEALTH has been Consolidating near the Support zone which also seems to be a prior Resistance, looks good for potential upside of 5%-8%.
Reasons to be bullish on MAXHEALTH:
1.Resistance becoming support is a bullish signal.
2.Impulse move from these levels seen before.
3.RSI is on good levels leaving space for bulls.
4.MACD is turning bullish but not moving too much, we can see it as an accumulation phase.
5.The support level is also 31.8% fib support.
BUY AVOVE: 343
Already given a breakout on 1 Hour timeframe so entry can be taken.
Please LIKE, COMMENT and SHARE to motivate and support me. I'll keep on posting new ideas on Indices & Stocks. Be sure to follow so that you don't miss any good trades that might have been rewarding.
Any comments and critiques will be appreciated even if it's of opposite view as a trader can also be right so many times.


