MCD 1D BEAR FLAG SHORT TRADEBear Flags are Ranges that are repeatable trading chart patterns.
Bear Flag chart patterns will have a directional bias depending on the previous incoming trend (short trade).
Each chart pattern will have defining trendlines of the support/resistance levels creating the pattern.
Whatever time frame you are trading this chart pattern, wait for a candle close outside of the trendline in the direction of the breakout candle. (Our time frame preference is the Daily chart).
Add volume indicator - Volume is the amount of $ that went into a particular candle or in Forex the # of trades that took place.
Add ATR indicator - Volatility is the amount of price movement that occurred. Use the ATR to measure the price movement.
When you see descending Volume bars and descending ATR line (which indicates volatility) this shows
a dis-interest in traders to invest in this pair creating consolidation which creates the chart pattern.
Trade Management after there is a breakout candle close.
1 - Position size (compare volume bar to volume ma line).
a - Breakout candle must be 100% of average volume for a full position size.
b - If 75% of average volume then ½ position size. (To find 75% of Volume
look at the charts volume settings – divide smaller # into larger # = 75%+)
2 - Enter two trades.
3 - SL for both trades will be 1.5 x ATR.
4 - 1st trade TP will be 1 x ATR.
5 - No TP on 2nd trade – letting profit run and adjusting SL to follow price.
6 - When 1st TP hit – move 2nd trade SL to breakeven.
7 - Adjust the 2nd trade SL to follow price.
*8 – After Breakout candle – if price closes back into chart pattern close trade
*9 - When breakout candle is more than 1 ATR from breakout candle open.
a - Enter 1st trade at candle close with ½ position size.
b - Enter 2nd trade with a pending limit order that is 1 ATR of breakout candle open.
c – Price should pullback to that pending limit order for 2nd trade.
d – If Price returns back into chart pattern close trade before SL is hit.
MCD

MCD dark cloudsDark Clouds formed over MCD. Wait for the end of consolidation; however if you must buy now keep a tight stop. And target sudden breakouts as high as 220
E: 208 +/-1 (upon trend reversal above 207.94)
T: 220
S: tight trailing

MC-DONALDS KEY LEVEL| BREAKOUT| TRADING PLAN|
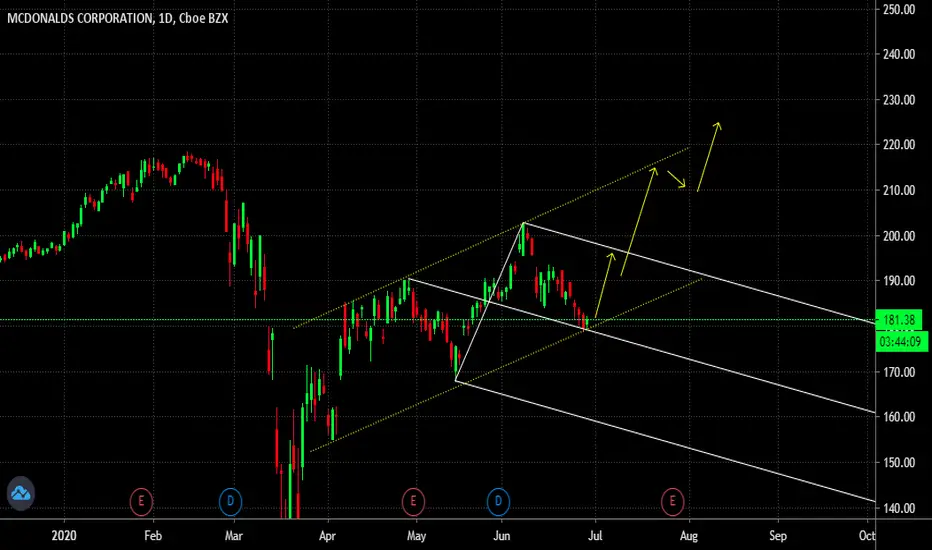
X MCD is trading in an upward channel
X Smaller channel is guiding the price now
X Faces key level resistance
X Wait for breakout>
X IF breakout higher>> long till red resistance
X IF breakout of the small upward channel downwards>> short till green support
X General trend still bullish till the big channel gets broken
LIKE + SUBSCRIBE= LUCK IN YOUR TRADES!


MCDONALDS: Our view for the nex 2 daysMCDONALDS close to short
Entry point 213.25
SL 218.63
TP 202.84
----------------------------------------
Trading Kitchen

MCD good setup and good chanceHey everyone,
MCD tested the triangle after it's breakthrough and will now go to the 161 retracement as the swing before in my oppinion. This time there is nothing more to say but good luck and much fun!
Entrance: as soon as the opening confirmes the upper side of the triangle
Stop: 201,50$
Goal: 217,40$
Much fun with that trade!
Leave a follow please, my goal is 200 :)

MCDONALDS: Our view for the nex 2 daysTwo possible intraday long for MCD.
1.
Entry 198.87
SL 197.80
TP 199.90
if breaks...
2.
Entry 194.00
SL 192.62
TP 195.64

Technical view of MCD (MacDonald) Hello every one
McDonald's stock is moving in a short-term sideways direction closer to the upside.
Continuing to maintain the bullish trend line leads it to 217.5 levels.
Negativity by breaking 187.5 down.
Good luck .

Long OPES (BURGERFI) AKA Chain Restaurant Industry $SHAK $MCDEntry $12 area
1st Target $18
2nd target $23
3rd target $32
Why?
Covid 19 Took this stock down hardcore but as the restaurant industry starts to recover, this start is going to fly! it is literally a steal right now!!
if market continues to be bullish, it will be like buying this stock at thrift store.
This is like getting into DKNG b4 they were a thing, or TSLA when it was CHUM CHANGE!!!!
In June Delivery Sales increased 65% Y/Y, and for first six months 3rd party delivery YTD + in-house app orders were up 428,000, sales reached $10.9M, order & sales volumes were up 32% and 60%.
In addition to partnerships with DoorDash, GrubHub, Postmates and UberEats, BurgerFi has developed its own app for third-party delivery.
OPES anticipates merger with BurgerFi to close in Q3.
What is OPES/ Burger Fi?
BurgerFi is an American fast casual restaurant chain focused on hormone-free and antibiotic-free angus hamburgers,
french fries, hot dogs, and custard. The first location was opened in February 2011 in Lauderdale-by-the-Sea, Florida.
www.burgerfi.com


MCD to 200 (still out of the flag) MCD is next. Ronal fucking mcdonald dude. Perfect breakout and catch. Right out of a bull flag BUT now it’s back in it’s triangle. PT is still 200. Calls we have are for August so will see what the rest of the week brings. Contract down a bit but we’ve got some time. For those who missed out we could be seeing better buying opportunity. Looking at the chart again it is still out of the flag so bullish run til earnings maybe. Will monitor.


MCD 200Looking to see a bounce at 180. It's moving slowly. 200 call for 7/24 is looking good. .29 premium. Will watch to see if the flag is filled or the stock is able to break above 187. McDonald's is a good stock long term. The important points are 180 and 187. Will watch it on Monday with everything else. If it falls down to the 180 I'll be looking for cheaper premiums.
trade smart

MCD Filling GapsCurrently MCD is in a downward trend and is currently just above a gap area. The 50 SMA is about to cross below the 200 SMA and that is a bearish signal, along with the fact that recently the stock has been printing lower highs and lower lows. I am looking to short all the way down to $168 where there is a support line. This support line is above another gap and if the support line breaks, MCD will drop to at least $161 if not lower.
I look forward to hearing your comments about the topic and am constantly looking for feedback to improve my analysis. I am open to discussion about my idea.


Mcdonalds Channel BuyBottom of channel
Potential breakout of broadening wedge which may be acting as a flag for a bull flag forming.
Personally i feel public sentiment for MCD is declining but im sure its used now just for its convenience.

MDC SignalIm getting MCD July 17, 200 Calls for MCD target is $203.11, this will likely be a day trade
Direct Message me if you want info on Trading group


McDonalds BreakOut Could Rally Above 210IF the bullish momentum observed on MCD is maintained throughout this week, then the stock could likely be eyeing 210 and above in coming weeks...
N.B
- Let emotions and sentiments work for you
-ALWAYS Use Proper Risk Management In Your Trades

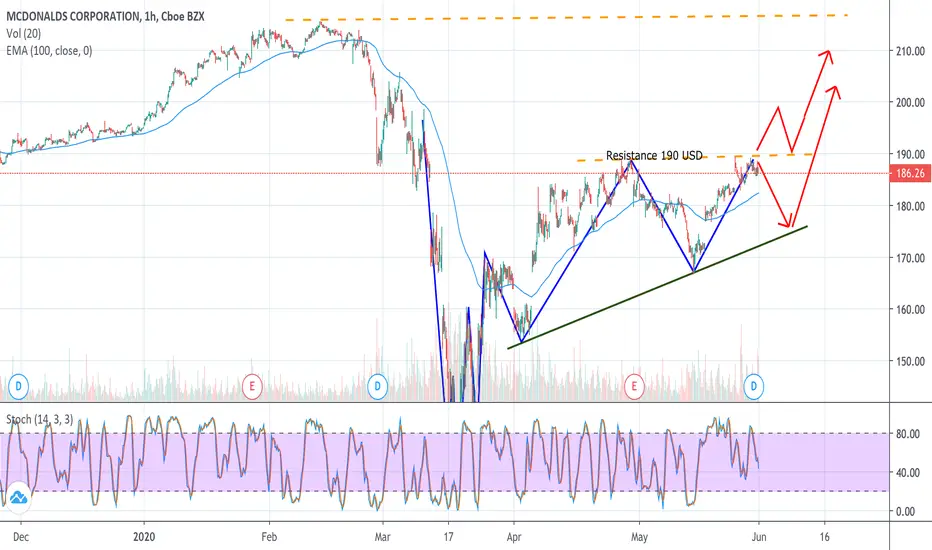
MCD - McDonald's Technical AnalysisTechnical Analysis - The idea is to go long but wait that the support of 190.00 usd will be broken before buying.
There might be a possibility of a price retracement that will test agin the bullish trendline.
Fundamental Analysis:
The fast-food chain was among the best performers during the Great Recession of 2008 and 2009 and looks poised to repeat that accomplishment
McDonald's The trend is bearish. So it's better to take only sell trades. For now use range trade rules.

"McDonalds: starting the down move" by ThinkingAntsOk4H Chart Explanation:
- Price bounced on the Resistance Zone.
- After that, it broke the Red Micro Descending Trendline.
- Now, price has potential to move down towards the Support Zones.
Weekly Vision:
Daily Vision:
Updates coming soon!
