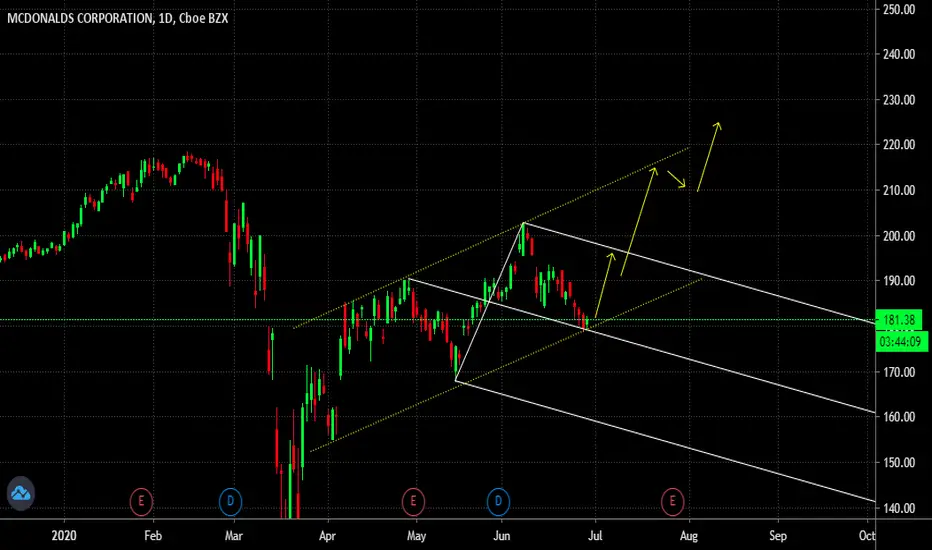
DAILY ANALYSIS OF MCDHi friends
the daily chart of this market shows with a very high probability that it will experience a downtrend until the level of 153.44with the vigilance that this market changes the direction towards the opposite direction
please subscribe to receive new analyzes
Mcdonalds

I said I saw a pennant formation... now the golden archesLook carefully as we get the McDonald's formation, golden arches. (Ok but seriously price momentum is still looking fairly bearish I wouldn't be buying unless you're doing a super quick trade)


Mcdonalds Channel BuyBottom of channel
Potential breakout of broadening wedge which may be acting as a flag for a bull flag forming.
Personally i feel public sentiment for MCD is declining but im sure its used now just for its convenience.


MDC SignalIm getting MCD July 17, 200 Calls for MCD target is $203.11, this will likely be a day trade
Direct Message me if you want info on Trading group

McDonalds BreakOut Could Rally Above 210IF the bullish momentum observed on MCD is maintained throughout this week, then the stock could likely be eyeing 210 and above in coming weeks...
N.B
- Let emotions and sentiments work for you
-ALWAYS Use Proper Risk Management In Your Trades

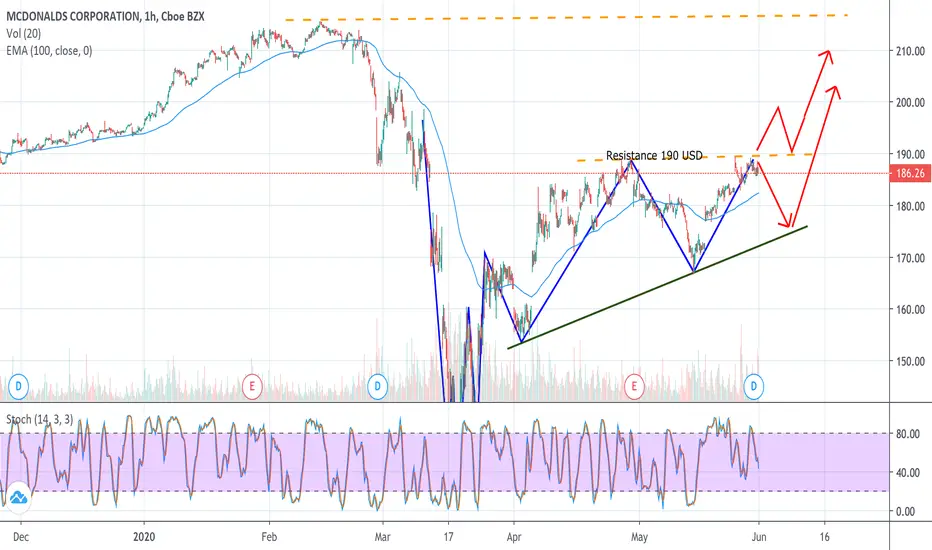
MCD - McDonald's Technical AnalysisTechnical Analysis - The idea is to go long but wait that the support of 190.00 usd will be broken before buying.
There might be a possibility of a price retracement that will test agin the bullish trendline.
Fundamental Analysis:
The fast-food chain was among the best performers during the Great Recession of 2008 and 2009 and looks poised to repeat that accomplishment
McDonald's The trend is bearish. So it's better to take only sell trades. For now use range trade rules.

"McDonalds: starting the down move" by ThinkingAntsOk4H Chart Explanation:
- Price bounced on the Resistance Zone.
- After that, it broke the Red Micro Descending Trendline.
- Now, price has potential to move down towards the Support Zones.
Weekly Vision:
Daily Vision:
Updates coming soon!

LONG MCDKeep your trading simple
Bullish Swing
T1 = minimum risk reward 1:1
I always leave 1/3 of my position for long term gains - moving my stop to my entry if I need to give room for the volatility or using trailing stop for maximum gains.
For maximizing your profits you can use Options.
Not a financial advise just my view - trade smart trade safe.
Follow me to support my work, Thanks!


Mickey D's TA testAlthough i feel Mcdonalds is used primarily for convenience by consumers bullish momentum should continue from a TA perspective on a Monthly time frame if you are looking to go long
Price has currently testing a long term trend line
Possible entry point for long

MCD - scalp puts to 181.63Broke out of rising wedge on daily chart
Bearish divergence btwn price (higher highs) and MACD (lower highs), with RSI making slight lower highs on the 4H
Broke out of rising wedge with volume on the 1H with MACD crossing down
Bearish divergence again; price (HHs) MACD & RSI with (LHs)
Zooming into the 15M chart, the 8MA has crossed down the 21MA and 50MA, a bearish sign
If $MCD breaks and holds below 184.33 with volume, it could see 181.63.
LMK WHAT YOU GUYS THINK!!! HAPPY TRADING


Mickey D's testingTesting an 8 year old trend line, upward movement is supported by the climbing trend on the MA indicator that can be observed. Will it hold? I think its likely.

#McDonalds - First Target hit The First Target at McDonalds hit today.
Whats next?
If correction goes on, next target should be $139.
Than we have to look if we change direction from short to long.

MCD hold or sell?MCD is holding its monthly support, if it breaks below this 148 watch for 140 then possible 137-135 gap fill. MCD is strong but the virus could hurt its sales enough to drop it lower.

MCD puts/call signalsMCD caught here, can start looking to buy puts at the 191.8 level but confirmation is below 188.8. Above 195.2 we can watch for higher with confirmation being 198.9

"McDonalds: bouncing from a critical level" by ThinkingAntsOk4H Chart Explanation:
- Price is on a Weekly Ascending Channel.
- Price is on the Support Zone and on the Bottom of the Ascending Channel.
- We expect price to move up towards the Resistance Zone.
Weekly Vision:
Daily Vision:
Updates coming soon!

MCD Exaggerated Bearish DivergenceExaggerated bearish divergence! Price makes two tops on approx same line, while the technical indicator in this case RSI produces a bearish divergence.

