MCDonalds Analysis + Trade Setup
In my opinion, this is one of the best sales deals on the current market.
In the monthly chart, this stock has a 5-wave trend, which is currently the end of wave 3 and we are at the starting point of wave 4. This wave will be in the form of A B C and it will be a big and rapid wave. The reason for its rapidity is the end of a 5-wave in the weekly time frame and a 5-wave in the daily time frame.
It is worth noting that wave A will start with a high initial acceleration and then take an oscillatory form with large fluctuations
Note: If you buy a transaction at this price, please be patient and focus more on your psychology so that you don't exit the market when emotional fluctuations start and save your profit completely.
Be successful and profitable.
Mcdonaldsshort
Short on open: 220.24 or higher
Real-Time Algorithmic Trading Signals. All trades are based on a Geometric HMM.
The Ingenuity Trading Model is a Geometric Hidden Markov Model with specific inputs related to Price, Time, Volume, and Volatility.
Our Algorithmic Trading Model offers real-time buy or sell signals with specific entry and exit prices. This affords you the freedom to successfully trade across all markets and market regimes. We are not interested in biased economic research or opinions on the latest Wall Street narratives. We do not trade based on conventional financial analysis. Our signals prove the power of taking a more scientific approach to trading the market.
MCD Public sentimentI know shorting this is not wise, however MCD public sentiment has been steadily declining despite its still incredible popularity, MCD has been in a HUGE bull run, however in my opinion we will see the rise of healthier alternatives and more traditional fast food chains, (Subway, Pizza restaurants)
Mcdonalds to the bottom !Hello, Traders!
Monfex is at your service and today we overview MCDONALDS Corporation.
Mcdonalds fired their CEO, with which the company's capitalization doubled.
The first downward movement was in early September, at the same time as the "The Game Changers" popular film about vegetarianism was released. Perhaps this is connected, but not exactly.
This year, the United Nations called on people to eat less meat.
Generally, the news background is negative for MCD.
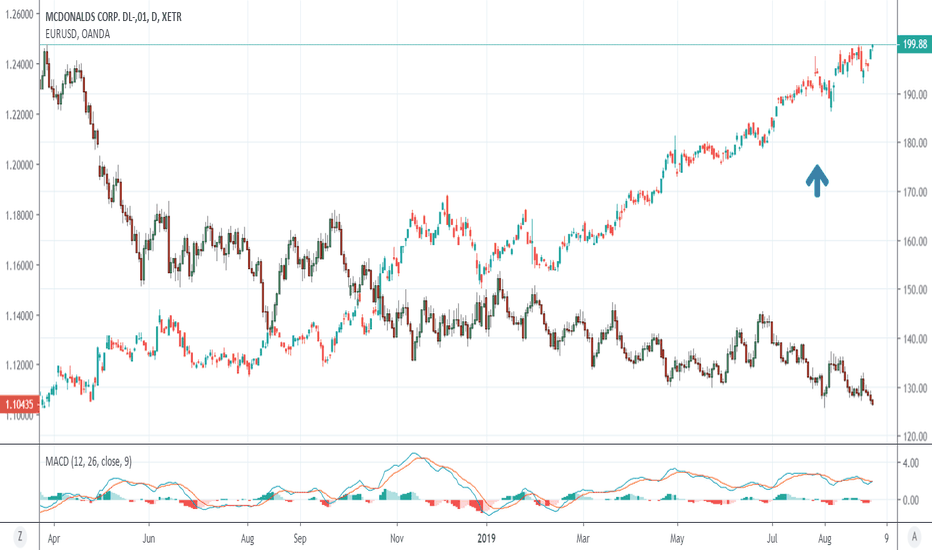
Also at this chart we see Elliott Waves (12345-abc) and how MCD in an uptrend movement so long. But recently, it broke the support line of the ascending channel and wedge.
The local resistance zone ~ $200
The local support zone ~ $190
Target zone ~ $160
Market Cap
$145.941B
Share your thoughts, ideas about the market under the chart.
Watch for our Updates to be the first who gets well-timed signals !
GOOD LUCK AND LOTS OF PROFITS !!
Disclaimer
This report is for information purposes only and should not be considered a solicitation to buy or sell any trading assets. Monfex accepts no responsibility for any consequences resulting from the use of this material. Any person acting on this trade idea does so entirely at their own risk.
Analysis on MCDONALDS 30.08.2019The price above 200 MA, indicating a growing trend.
The MACD histogram is above the zero lines.
The oscillator Force Index is above the zero lines.
If the level of resistance is broken, you should follow the recommendations below:
• Timeframe: H4
• Recommendation: Long Position
• Entry Level: Long Position 222.00
• Take Profit Level: 225.00 (300 pips)
If the price rebound from resistance level, you should follow the recommendations below:
• Timeframe: H4
• Recommendation: Short Position
• Entry Level: Short Position 219.00
• Take Profit Level: 218.00 (100 pips)
USDJPY
A possible long position at the breakout of the level 116.70
EURUSD
A possible short position in the breakdown of the level 1.1030
USDCHF
A possible long position at the breakout of the level 0.9900
GBPUSD
A possible short position in the breakdown of the level 1.2150
$MCD McDonald's Weekly True Bearish HaramiMCD McDonald's has just completed printing a true Bearish Harami two candle pattern. True Harami's are explained in linked diagram below. The body of the second, inner candle needs to be no bigger than 25% the size of the preceding candle, in which case this one qualifies. A true large bullish candle at the top of an uptrend, followed by a 75% smaller bodied bearish candle that gaps down from the previous closing price, and is fully contained by the preceding bullish candle. That's a reversal indicator and a good spot to get short MCD if you've been looking to. I believe we could see the 202's area on a pullback. This is a stock that generally outperforms when the markets are in true turmoil, and has been on a tear lately. I wouldn't want to stay short for very long personally. I like August 30th P205, currently trading for .40 per contract for this play. Happy hunting and GLTA!! a.c-dn.net


