GRASS About to EXPLODE or COLLAPSE? Traders Could Get Trapped inYello, Paradisers! Are you ready for what could be one of the most deceptive breakouts we’ve seen this week? #GRASSUSDT is showing signs of strength, but as always, we need to stay sharp and look beneath the surface to avoid getting trapped like 90% of the herd.
💎#GRASS is knocking on the door of a key descending resistance trendline that has been respected multiple times this month. The current price action is attempting to break above it with momentum, and a confirmed breakout could trigger a strong probable impulsive move toward the next resistance levels at $1.2630, $1.3959, and eventually even $1.6512.
💎But what gives this setup its real probability strength is what most retail traders are overlooking: the confluence between minor support at $1.10–$1.15 and the short-term EMAs on the 4H timeframe. The 50 EMA and 100 EMA are starting to curve upward and align just above this support range, offering a strong dynamic base. This zone isn’t just visual support anymore—it’s turning into a technical launchpad.
💎From a technical standpoint, any clean 4H candle close above the trendline and $1.2630 resistance will increase the probability of continuation toward the mid-range resistance near $1.3959. However, failure to break above this zone convincingly or a rejection back into the previous range could signal that market makers are just pushing price up to trap breakout traders before dumping it again.
💎Support remains firm in the $1.10–$1.15 zone, but invalidation is crystal clear — any 4H candle close below $1.0549 would negate this bullish outlook entirely and suggest a deeper move is coming. That level has held well so far, but remember: one quick breakdown can wipe out many weak hands.
💎This is exactly the kind of setup that separates emotional traders from strategic ones. Many will FOMO in right at the breakout without considering the higher timeframes or waiting for confirmation.
Strive for consistency, not quick profits, Paradisers. Treat the market as a businessman, not as a gambler. Only the patient and prepared will survive and profit from these types of traps. Let’s continue to stay smart, strategic, and wait for the best high-probability opportunities.
MyCryptoParadise
iFeel the success🌴
MCP

SEIUSDT on the Brink of a Major Explosion… or Total Breakdown?Yello Paradisers! Are you prepared to act with precision—or will you get trapped like the rest before the real move begins? #SEI has entered a highly reactive price zone where one wrong candle could invalidate the entire bullish structure. The market is whispering its next move, but only those who understand structure and timing will be ready to capitalize.
💎#SEIUSDT has completed a significant transition from a bearish trend structure to a more bullish one. Earlier, the price formed consecutive Lower Lows (LL) and Lower Highs (LH), confirming bearish momentum. However, that trend shifted once the market printed a Market Structure Break (MSB) around the 0.2121–0.2253 range. This area—previously acting as resistance—has now flipped into a confirmed support zone, marking a critical bullish development.
💎The structure strengthened further when SEI broke above the prior Higher High (HH) and created a Break of Structure (BOS). That move catapulted price into the red resistance zone between 0.2929 and 0.3152, just beneath the last major swing high at 0.3471. This zone is now acting as a ceiling, containing bullish pressure—but the underlying structure remains intact unless we see an invalidation close below key levels.
💎High probability, SEI i retracing back into the 0.618 Fibonacci level at 0.2269, which aligns precisely with the flipped support zone. This is a textbook bullish retest, and as long as the price holds above 0.2121, the probability for continuation remains high. The coming candles will be decisive: they will either confirm strength and fuel continuation—or fail and lead to a complete structure breakdown.
💎If buyers manage to hold the key support zone between 0.2269 and 0.2121, the probability of a bullish continuation increases significantly. The first major target on the upside is 0.3471, which marks the previous swing high and is likely to act as the initial area of resistance. A clean break above that level could open the path toward 0.3812, followed by 0.4086, both of which align with higher timeframe supply zones and represent strong historical resistance. These levels are expected to attract profit-taking and short-term volatility, making them critical decision points for continuation or rejection in the next phase of SEI’s move.
💎However, traders must be alert: any candle close below 0.1554 will serve as a hard invalidation level for this bullish thesis. If that happens, the structure flips bearish, and we would anticipate a deeper correction toward 0.1361 or even lower. That’s the line we are not willing to ignore—structure and discipline come first.
This is not the time to trade emotionally, Paradisers . Retail traders will act impulsively—either FOMOing at the highs or panic-selling at the lows. The smart move here is to observe how price reacts and only execute if there’s clear confirmation and structure support. No guessing. No gambling.
MyCryptoParadise
iFeel the success🌴

FIO Breakout: Is This the Calm Before a Massive Move or a Trap?Yello Paradisers! did you catch the breakout on #FIOUSDT or are you still sitting on the sidelines while opportunity unfolds? The recent move is shaping up to be a high-probability setup, but only for those who understand the market structure and know how to manage risk properly.
💎#FIO has been consolidating inside a well-defined falling wedge on the 12-hour timeframe—a pattern known for its bullish reversal potential. After weeks of compression, we finally saw a clean breakout to the upside, followed by a textbook retest of the wedge’s upper boundary. This breakout-retest sequence confirms that the previous resistance has now flipped into a support zone, a key technical signal we always monitor closely.
💎Adding further conviction to the setup, FIO is currently supported by multi-timeframe EMAs, acting as dynamic support. When combined with horizontal levels, these EMAs offer traders additional confluence and often indicate that the market is preparing for a stronger impulsive move. What’s particularly notable here is the alignment with key Fibonacci retracement levels. The price is holding just above the 0.618 retracement level—a golden pocket that often acts as a springboard in continuation setups. This creates a high-confluence support zone between 0.0139 and 0.0143, where bulls have a clear technical advantage.
💎To the upside, should keep a close eye on two major resistance zones. The first lies at 0.01689, which marks moderate resistance and the likely first target should bullish momentum continue. The next level of interest is 0.01950—identified as a major resistance zone. A break above that could open up significant upside potential, but we’ll stay measured and reactive based on how price interacts at each level.
💎On the other hand, the invalidation level is clearly defined. A candle closing below 0.01213 would invalidate the current bullish structure. If this level is breached, it’s a strong signal that the setup has failed and the risk needs to be cut immediately. No second chances there—discipline is key.
💎All in all, FIO has triggered a technically clean breakout from a falling wedge, retested the breakout zone, and is now forming a strong base above multiple supports. However, confirmation is always key. As long as it holds above the 0.0139–0.0143 support cluster, the bias remains bullish and the probability favors continuation to the upside.
We are playing it safe right now, Paradisers. If you want to be consistently profitable, you need to be extremely patient and always wait only for the best, highest probability trading opportunities.
MyCryptoParadise
iFeel the success🌴

NEAR Breakout Confirmed—But Is This Just a Bull Trap?Yello Paradisers! Did you see that breakout on #NEARUSDT? After weeks of consistent lower highs and a clearly defined descending resistance, price action has finally snapped that bearish structure and completed a textbook inverse Head and Shoulders formation on the 12H chart. This kind of pattern doesn’t appear often at key cycle points, and when it does—especially with confirmation—it becomes a high-probability signal of a trend reversal.
💎#NEARUSDT ,The neckline of the inverse H&S, sitting around the $2.17–$2.23 zone, has now been broken and crucially retested as support. This means the former resistance is now acting as a probable base for bulls, and if price remains above this area, the market is likely preparing for a strong probable impulsive move to the upside.
💎The structure shows clear bullish intent, and from a technical perspective, the first resistance comes in at $2.72. A clean break above that could open the door toward the major resistance zone between $2.97 and $3.05, which would complete the projected breakout target of the H&S pattern.
💎If bulls manage to maintain control above the $2.17–$2.23 support zone, we expect price to slowly build momentum toward $2.72, with increased volatility likely once that level is tested. Should that break occur with volume, the next leg may extend rapidly into the major resistance zone. However, if price fails to hold above this flipped support zone, we will be closely watching the $2.02–$1.89 area as the last major support before invalidation.
💎A daily candle closing below $1.798 would invalidate this entire bullish thesis and put the market back into a neutral-to-bearish range.
💎Adding more probability to this setup, NEAR is now trading above multi-timeframe EMA on higher time frame. This multi-timeframe EMA alignment supports bullish continuation, as momentum begins to shift in favor of buyers. However, continuation depends heavily on how price reacts at each resistance level—especially as we enter the mid-$2.70s.
💎The probable move from here is bullish, with the expectation that NEAR pushes toward the $2.72 level in the short term, followed by a potential rally to $2.97–$3.05 if momentum sustains. This scenario remains valid as long as price holds above $2.17, and especially above $2.02. Below that, the structure weakens. Below $1.798, the bullish bias becomes fully invalidated.
This is the only way you will make it far in your crypto trading journey. Stay sharp and patient, Paradisers. It’s not about chasing pumps—it’s about positioning smartly before the crowd.
MyCryptoParadise
iFeel the success🌴

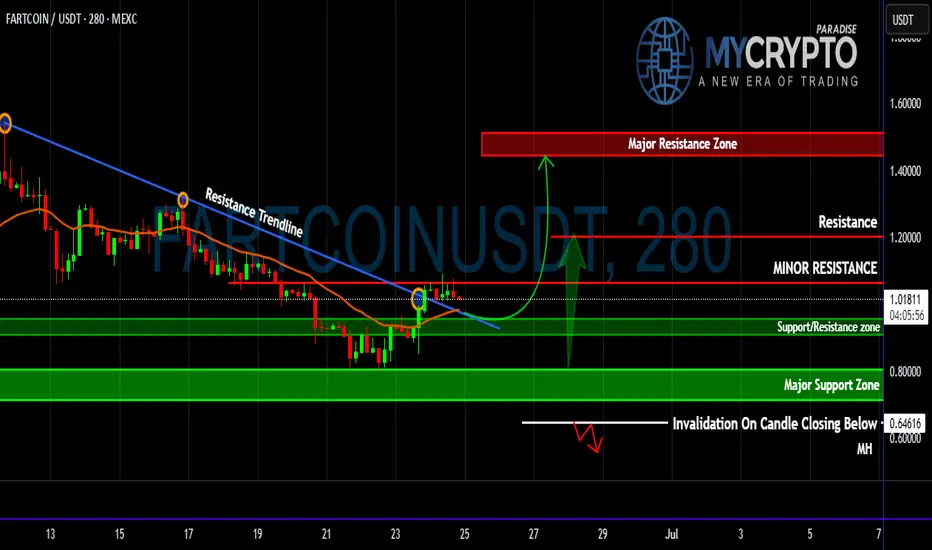
FARTCOIN Flipped Key EMA—Is This the Start of a Pump or Trap?Yello Paradisers ! Are we looking at a breakout that could deliver massive upside, or is this just another emotional trap before the next leg down? The market has been ruthless lately, and unless you base your decisions on structure, probability, and proper confirmation, you’re gambling—not trading. Let’s break down this #FARTCOIN setup from a professional standpoint.
💎#FARTCOIN has finally broken above a clearly defined descending resistance trendline, signaling a potential probable shift in short-term momentum. This breakout occurred precisely as the price reclaimed the multi-timeframe EMA —a key dynamic level that has consistently acted as resistance throughout the downtrend. The reclaim and hold above this EMA significantly increase the probability of a short- to mid-term trend reversal, especially as it aligns with an early attempt to build a bullish market structure.
💎Price is now trading just below a minor resistance level. This zone has capped previous upward attempts and is the first level bulls must overcome for continuation. A confirmed 4H/1H or daily candle close above this resistance will open the door to a measured move toward the next key level at $1.20265, with extended upside potential into the major resistance zone between $1.44660 and $1.55099. Should bullish momentum pick up with increasing volume, a Probable upside move becomes a realistic scenario.
💎However, none of this is guaranteed. We're dealing with probabilities, not certainties. The support/resistance flip zone between $0.95949 and $0.90596 now becomes a crucial reference point. A healthy retest of this area could provide a higher-probability long entry, especially if price continues to respect the reclaimed EMA. Below that, the major support zone from $0.80693 to $0.71058 represents a broader demand block. If the price pulls back this far, it may signal the formation of a larger accumulation range rather than immediate continuation.
💎To manage risk effectively, traders must monitor the invalidation level at $0.64616. A 4H candle close below this level would nullify the bullish breakout scenario and increase the probability of renewed bearish control, suggesting the recent breakout was a deviation or fakeout.
Stay sharp, Paradisers! Will this be a breakout or a fake-out? Only time—and disciplined trading—will tell!
MyCryptoParadise
iFeel the success🌴
ORDIUSDT Hanging by a Thread Before the Next Leg Down?Yello Paradisers! Are you ready for the next big move on #ORDIUSDT? Because if you’re not already positioned or thinking three steps ahead, this structure could catch you off guard. We’re seeing signs of exhaustion, and the market is setting up for another potential drop. Here’s what you need to know before it's too late.
💎#ORDIUSDT remains in a clear downtrend, printing consistent lower highs and lower lows. Each rally is weaker than the last, and buyers have failed to break above key resistance zones. After the most recent failed bounce into the 7.28–7.51 area—where support has now flipped to resistance—sellers regained control and pushed price back below the 21 EMA. This confirms the
bearish momentum remains dominant and is high probability to go further down.
💎The structure continues to print classic breakdown signals. Multiple breaks of structure (BOS) further validate the downtrend. As long as price remains under the 8.47 invalidation level, there's no technical reason to consider a bullish scenario. Any short-term bounce into resistance is more likely to be a selling opportunity rather than a reversal signal.
💎If price continues lower from here, we’re watching the support levels at 6.46 and then the major support level between 5.79–5.53. A sweep of those levels could trap late shorts, but until we see a confirmed shift in market structure, our bias remains bearish. Patience will be rewarded here.
💎This is a classic scenario where retail traders often get chopped up. The real move comes after both sides get squeezed. Don't be part of the noise.
Strive for consistency, not quick profits. Treat the market as a businessman, not as a gambler. The downtrend is clear, but only disciplined traders will be able to extract profits here without emotional mistakes. Stay sharp, stay strategic, and above all—stay safe, Paradisers.
MyCryptoParadise
iFeel the success🌴

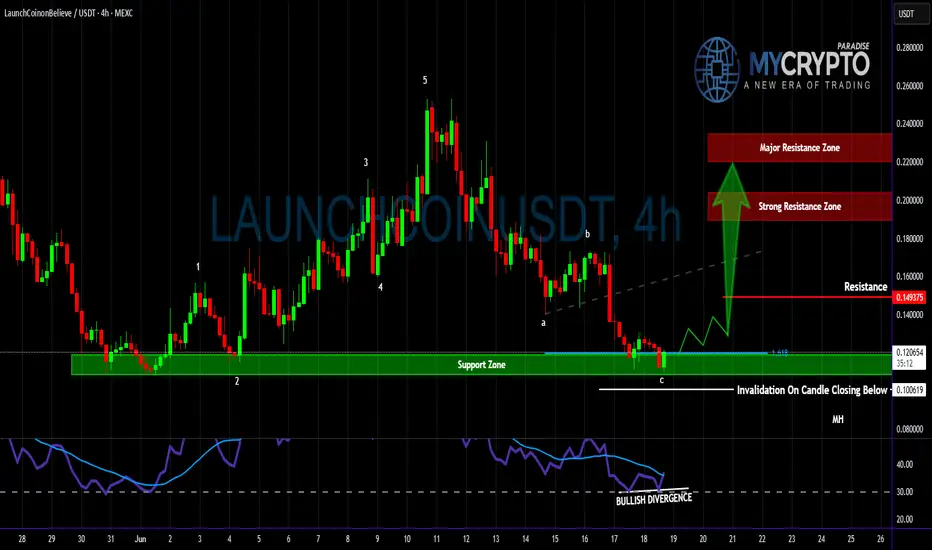
Wave C Complete — Time for the Real Move on LaunchCoin?Yello, Paradisers! Is #LaunchCoin about to reverse from its brutal downtrend? After completing a probable ABC correction right at key support, the conditions are setting up for a potential bounce — but only for those patient and prepared.
💎#Launchcoinusdt ,We’re most likely looking at the final leg of a Zig-Zag correction pattern, with wave C landing precisely within a well-defined support zone between 0.1006 and 0.1060. This zone has held up well so far, and there’s a clear bullish divergence forming on the RSI, which statistically increases the probability of a short-term reversal from this level.
💎The structure suggests we’re near a local bottom, but follow-through is essential. A sustained reclaim of the 1.618 Fibonacci extension level could act as a confirmation trigger for further upside. If that occurs, we expect price to approach the next resistance at 0.1493, followed by a strong resistance zone between 0.1900–0.2000, and eventually the major resistance around 0.2200–0.2350.
💎However, invalidation remains clear: any 4-hour candle closing below 0.1006 would reduce the probability of this bounce playing out and shift the bias back toward further downside. Until then, the setup remains valid and tradable for those who follow a structured and disciplined approach.
Paradisers! we are playing it safe right now. If you want to be consistently profitable, you need to be extremely patient and always wait only for the best, highest probability trading opportunities.
MyCryptoParadise
iFeel the success🌴
ENA About to Explode or Dump? Key Levels You Can’t Ignore!Yello Paradisers — are you positioned right for the next potential explosion in #ENA, or will you get caught on the wrong side of the move like most retail traders? After a brutal grind in a descending channel, something big is brewing... and it’s coming faster than many realize. Let's dive in.
💎#ENAUSDT currently facing a key resistance at the upper boundary of the descending channel, clearly tested multiple times and respected well by the market structure. A candle close above this channel would trigger a confirmed breakout, which opens up a clean path for continued upside movement — the next major target sits at the resistance zone between 0.446 and 0.4725.
💎There’s a high-probability alternative setup unfolding as well: ENA holding the S/R level around 0.3448 and the demand zone below, which aligns perfectly with the multi-timeframe EMA support. If this area holds strong, expect another impulse move toward our resistance zone as momentum builds.
💎Price had been forming lower highs and lower lows, respecting the downtrend But recently we observed a Clear Change of Character (ChoCH) — ENA broke market structure by forming a higher high.What usually follows? A higher low, and that’s where we are now.
💎The most probable scenario is for price to pull back to the S/R level or dip into the demand zone, and then form a higher low before making the next leg upward toward resistance.
💎Invalidation is simple and must be respected: if we see a confirmed candle close below 0.2798, then the bullish case breaks and the setup is no longer valid. This is where you must cut quickly, avoid hope-trading, and reassess the structure from scratch.
Don’t chase. Don’t panic. React with strategy, not emotion. This is how real professionals win in crypto. Stay sharp, Paradisers.
MyCryptoParadise
iFeel the success🌴

XRP Is Quiet—But This Calm Is Deceptive!Yello Paradisers—have you noticed how #XRP isn't on anyone’s radar right now? It’s not trending, no one’s hyping it, and to many, it’s just another slow mover. But here’s the thing: this type of silence often comes before the real storm, and the technical are quietly lining up.
💎#XRPUSDT is seeing now a period of consolidation The 1D bullish trend structure has been broken, and since then, price has entered into a tightening consolidation phase. While this may seem like indecision, it’s more likely a preparation for a potential high-probability upside expansion.
💎Price is now hovering just above the 0.786 Fibonacci level (~$2.25), which has started acting as a soft support. This is not a level to blindly trust, but one to monitor for reactions. If price manages to hold here, the next high-probability target lies at the short-term resistance around $2.5917, followed by major resistance at $2.9480, which aligns with a broader liquidity zone.
💎One key factor to keep in mind: the descending trendline liquidity has not been swept for a long time. That uncollected liquidity still sits just overhead, and markets usually don’t leave such inefficiencies behind forever. A spike toward that zone becomes increasingly probable the longer we range here.
💎At the same time, the MTF EMA on the daily chart is acting as a soft dynamic resistance, pushing the price down gradually. This setup increases the probability that we may see another touch of the 0.786 level. If that fails to hold decisively, the next likely area of interest will be the major support zone around $2.00.
💎Still, that major support remains unbroken and continues to act as a probability-backed structure for potential bullish defense. Until we get a clean daily candle close below $1.791 (invalidation level), this entire zone remains technically favorable for a potential reversal or liquidity sweep to the upside.
We are playing it safe right now, Paradisers. If you want to be consistently profitable, you need to be extremely patient and always wait only for the best, highest probability trading opportunities.
MyCryptoParadise
iFeel the success🌴

AERODROME About to Defy Gravity? One Final Obstacle!Yello Paradisers — did you catch this developing setup in real-time on #AERO? After calling the completion of the higher-degree Elliott Wave 1 structure followed by an ABC correction, the chart is now flashing a high-probability opportunity — but only if a key resistance gets flipped in the coming sessions.
💎#AEROUSDT appears to have just wrapped up with point C printing a strong bounce from the R/S level, a zone that previously acted as a powerful base during the earlier markup phase.
💎The impulsive 5-wave structure clearly marked the first leg of strength, topping out perfectly in confluence with standard wave theory. What followed was a clean and controlled ABC correction.
💎Price action is currently pressing up against a well-defined resistance, which is not just horizontal but also perfectly aligned with the dynamic MTF EMAs — creating a confluence rejection zone. These moving averages have been compressing into the structure, adding weight to this level as a final barrier before a breakout scenario can unfold.
💎What we are now watching is simple: if we get a confirmed candle closing above the current resistance range, it would be a textbook continuation signal. That close would signal a probable structural shift — a break away from the corrective phase and the beginning of a new leg toward higher resistance levels around the 0.754 to 0.792 zone.
💎Until then, caution is critical. Any weakness or failure to close above resistance would imply the pair is not ready yet. Worse, a candle closing below the 0.446 invalidation level will confirm that the bulls are not yet in control and a deeper move is likely before a real reversal emerges.
💎This setup is not one to force — but it's certainly one to track closely. Everything is aligned for a breakout, but we do not front-run resistance in uncertain zones. That’s where most get chopped up. Confirmation is key, and when the market gives it, we act with full conviction.
This is exactly how Paradisers operate. We wait. We confirm. We execute only when all pieces align. No guessing, no emotional decisions — just disciplined, high-probability trading.
MyCryptoParadise
iFeel the success🌴

AVAX About to Nuke Longs Before Pumping to $30?Yello Paradisers — are you prepared for the next major #AVAX move, or will you once again fall into the trap smart money is setting right now? The chart is screaming probable bullish continuation, but not before one final trick to flush out weak hands. We warned you before — and now the game is unfolding exactly as expected.
💎#AVAXUSDT has clearly broken market structure by forming a higher high, confirming a potential trend shift. However, price failed to close above the 25.82–26.93 resistance zone, leaving the bullish breakout unconfirmed. This hesitation right at a critical level increases the probability of a fakeout or liquidity sweep before any continuation.
💎Right now, we are hovering just above the ascending trendline, and based on current structure, the most probable scenario is a sweep of that trendline liquidity, grabbing stops from impatient longs before the market forms a clean higher low and reverses aggressively to the upside.
💎The green zone around 22.00–23.00, which previously acted as resistance, has now flipped to support. As long as price holds above this level, the bullish probability remains dominant. However, if we see a temporary dip below the trendline toward the 19.08 region, where support lies, that would likely be a classic liquidity hunt — designed to trigger fear, force early exits, and then reverse powerfully into the next leg.
💎And while both scenarios favor upside, it is the path of maximum frustration — likely a wick into 19.00 — that has historically proven most probable before larger breakouts.
💎A sustained move above the 26.93 level, especially on a daily candle close, would significantly increase the probability of continuation toward the major resistance between 30.00 and 30.74. This zone remains the main upside target in the short to mid-term.
💎On the other hand, if price closes below 16.67, that would invalidate this bullish outlook and open the door to deeper downside. Until then, structure remains bullish, and the higher-probability outcome still favors upside after a potential short-term shakeout.
This is the point where the weak hands get shaken out and smart money reloads, Paradisers. If you're aiming for long-term success, wait for high-probability setups and protect your capital. Strive for consistency, not quick profits. Treat the market as a businessman, not as a gambler.
MyCryptoParadise
iFeel the success🌴

FARTCOIN’s - High Probability Breakout or Devastating Trap?Yello Paradisers, are you truly prepared for what #FARTCOIN is signaling right now? Because this setup is dripping with opportunity—but only for those who understand market structure and probability. After a steady grind lower inside a clean falling wedge formation, price just printed a high-probability deviation below the key support/resistance zone before snapping back inside. That kind of fakeout is no joke—it’s often the precursor to a major reversal. But will this deviation mark the beginning of a bullish surge, or is it a calculated trap before another leg down?
💎#FARTCOIN is hovering just above the reclaimed support/resistance area between 0.95 and 1.00. Historically, this level has played a pivotal role. The recent deviation below and swift recovery adds to the probability that this is a classic shakeout—designed to liquidate weak longs and trap aggressive shorts. However, we must be cautious.
💎Hovering above price is the multi-timeframe EMA (represented by the orange line), which is currently serving as dynamic resistance. As long as this EMA remains unbroken, bullish momentum is at risk of stalling. The probability of continuation only rises significantly if this EMA is reclaimed with strong candle closure above it.
💎The next obstacle is the minor resistance zone around 1.04667. A sustained breakout above this level will increase the probability of a move toward 1.20265, and if momentum builds, there’s a strong case for price to reach into the higher time frame major resistance zone between 1.45 and 1.50. However, we’re not there yet—and probability works both ways.
💎Should FARTCOIN fail to hold the reclaimed zone, or if price gets rejected at either the EMA or minor resistance, the bearish scenario comes back into play. In that case, price could collapse back into the wedge, increasing the likelihood of a drop toward the major support range between 0.73 and 0.64. Even worse, a confirmed 12-hour candle close below 0.60 would invalidate the entire bullish wedge setup and open the probability for a deeper correction.
This is the point where the weak hands get shaken out and smart money reloads, Paradisers. If you're aiming for long-term success, wait for high-probability setups and protect your capital. Strive for consistency, not quick profits. Treat the market as a businessman, not as a gambler.
MyCryptoParadise
iFeel the success🌴

Double Top Alert: SOLUSDT Setup Screams ReversalYello Paradisers, will you act like a pro and prepare for the next clean short opportunity on #SOLUSDT, or will you fall for the same breakout trap again just before the market punishes greed?
💎#SOLUSDT is displaying a textbook double top formation just under a well-respected resistance zone. This kind of structure is no joke—it’s a consistent precursor to sharp downside when liquidity gets taken from retail longs who are too eager to buy high. The market rarely gives second chances. What you’re looking at now is one of them.
💎Price has printed a double top around the $185 to $188 region. That zone has repeatedly acted as a ceiling, and buyers have failed to maintain any strength above it. The lack of follow-through is a major sign of exhaustion, especially after the second tap failed to even test the previous high with conviction.
💎Instead of breaking out, SOLUSDT has rolled over and is now struggling under the $176.23 minor resistance. That weakness is already being confirmed on lower timeframes. As long as this area holds as resistance, there is no justification for any probable aggressive long setups. This is a market preparing to punish overleveraged traders.
💎There’s a clear invalidation for this setup, and it’s extremely important to stick to it. Any 4H candle closing above $190.18 would break this structure and force us to step back and reassess the setup. Until that happens, the current bearish thesis remains firmly in play.
💎The nearest support sits at $168.86 which has highest probability that price may visit there. This level may act as a brief pause, but if the selling intensifies, it will likely break. A confirmed move below that level opens the door toward the true target of this breakdown, which is the $153.95 major support zone. That’s where we’ll be watching for a real reaction.
💎The current structure is heavily skewed toward the downside. Bears are clearly in control below $176.23, and the market has shown no signs of reclaiming key levels that would shift that control back to the bulls. Any bounce should be treated as corrective unless proven otherwise by a structural shift.
Strive for consistency, not quick profits, Paradisers. Treat the market as a businessman, not as a gambler. If you master that mindset, you’ll already be far ahead of the crowd.
MyCryptoParadise
iFeel the success🌴

SUI Structure Complete – Time for Pain or Profit?Yello Paradisers, have you noticed how calm #SUIUSDT has been lately? Feels like nothing’s happening... but that's exactly how the market sets the trap before it strikes. The recent price action has lulled many into a false sense of comfort, trading tightly in a sideways structure after a strong impulsive leg. But behind that calm surface, a bigger move is loading — and only those who can read the structure properly will be prepared for it.
💎#SUI has now completed its 5-wave Elliott impulse, finishing with a classic Ending Diagonal in the fifth wave, which very often signals the final push before a correction. Given the current price action, we are likely in the early formation of an ABC corrective structure, most probably a Zigzag or Flat formation. This transition is crucial — many traders misinterpret this as the start of a new trend and get trapped. But as professionals, we know that this is not the time to rush into positions. This early corrective phase often includes fakeouts and liquidity grabs, punishing both longs and shorts before clarity returns.
💎SUI has been trading with high volatility compression, coming off a significant bullish breakout that began around early April. The rally initiated with a textbook Leading Diagonal, moved into a sharp Wave 3 impulsive expansion, and finally started to slow down into what looked like exhaustion through Wave 5. During this phase, price carved out a Contracting Triangle (Falling Wedge), providing a resting phase before the final fifth wave. But right after the Ending Diagonal was completed, momentum has stalled, and now we're entering a very tricky part of the market cycle — the corrective phase.
💎Zooming out, the entire structure has unfolded in a methodically clean and technically sound manner. Wave 1 kicked off the move with a Leading Diagonal, signaling the early stages of bullish initiation. This was followed by a shallow Wave 2 retracement, which is typical of fast, trending markets. Wave 3 then expanded with strong bullish momentum, confirming the impulse. After that, Wave 4 transitioned into a Contracting Triangle (Falling Wedge) — a classic consolidation pause before the final push. Finally, Wave 5 wrapped up the sequence with an Ending Diagonal, a clear sign of momentum exhaustion. This full five-wave development marks a textbook impulsive structure, and strongly suggests that we are now entering a critical transition phase, where the market moves from trending into correction. These are often the most deceptive parts of the cycle — known for shakeouts, liquidity traps, and emotional whiplash for those who act too soon.
💎Looking ahead, the next probable strong move depends on how price reacts around the key S/R level at $3.006. If this zone holds and the correction stays controlled above it, we can prepare for a powerful continuation leg back toward the $4.20 resistance, and potentially challenge the major resistance at $4.80–$5.00. However, if the correction unfolds deeper, a full retest of the $2.40–$2.00 range is absolutely on the table. This zone aligns with macro demand levels and could act as a reload zone for the next major impulse. But only once the correction completes.
💎One of the main hurdles SUI now faces is breaking cleanly above $4.20 — this is the near-term barrier where supply pressure remains strong. Beyond that, $4.75–$5.00 is a macro resistance zone that needs significant volume and structure to crack. Until then, any sharp move upward could just be part of a larger fakeout inside the corrective pattern.
💎On the downside, our key invalidation level sits just below $3.00. A 12H candle close below $3.006 would confirm that the support zone is lost and shift our bias into a much deeper retracement phase. This would invalidate any early bullish setups and bring the $2.40–$2.00 zone in play, with liquidity likely waiting beneath that structure.
This is the point where the weak hands get shaken out and smart money reloads. If you're aiming for long-term success, wait for high-probability setups and protect your capital. Strive for consistency, not quick profits. Treat the market as a businessman, not as a gambler.
MyCryptoParadise
iFeel the success🌴

SOLUSDT Reversal Brewing — Watch This Level or Get Wrecked!Yello Paradisers — Are you paying attention to #SOLUSDT? Because what’s forming right now isn’t just noise — it’s a high-probability reversal setup that could trap the late bulls or become the kind of move that sets the tone for the next few weeks. Either way, the next play is going to separate professionals from gamblers. Let’s talk.
💎#SOLUSDT has been printing textbook bearish price action for weeks — lower lows and lower highs on the major time frame. But something critical has just changed. A break in market structure has occurred, and we’ve now got a higher high. That’s your first probable signal that the tide may be turning. Now comes the most important test — can we form the higher low to confirm this shift?
💎What makes this setup even more interesting is that we’re not just seeing a random bounce. SOL is in the middle of potentially probable completing two major bullish reversal patterns — an inverse head and shoulders and a Quasimodo. The left shoulder and neckline are already locked in. The right shoulder? Still cooking. But here’s the thing — the previous resistance, which aligns perfectly with where the right shoulder could form, is lining up as a textbook retest zone. That means we could get the higher low right there, completing both patterns at once.
💎Right now, price is struggling against multi-timeframe resistance, and that’s exactly what we want. It increases the probability of a short-term pullback to the key zone — around 110.9 to 115 — before the real breakout happens. If that level holds, and we print a confirmed higher low, this whole setup becomes explosive.
💎First area of resistance sits at 153, but that’s just the appetizer. The main zone we’re looking at is 173 to 181. That’s the bigger move that this structure is potentially building toward. But let’s be clear — if SOLUSDT closes a candle below 110.9, the entire setup gets invalidated. That level is your line in the sand.
This is the kind of setup we live for — clean structure, clear invalidation, and serious upside potential. But don’t rush it. The market will reward the ones who wait, not those who chase. Let others panic. Let others fomo. You focus on execution.
Trade smart, Paradisers — and always remember, only a few will catch the real move. Be one of them.
MyCryptoParadise
iFeel the success🌴

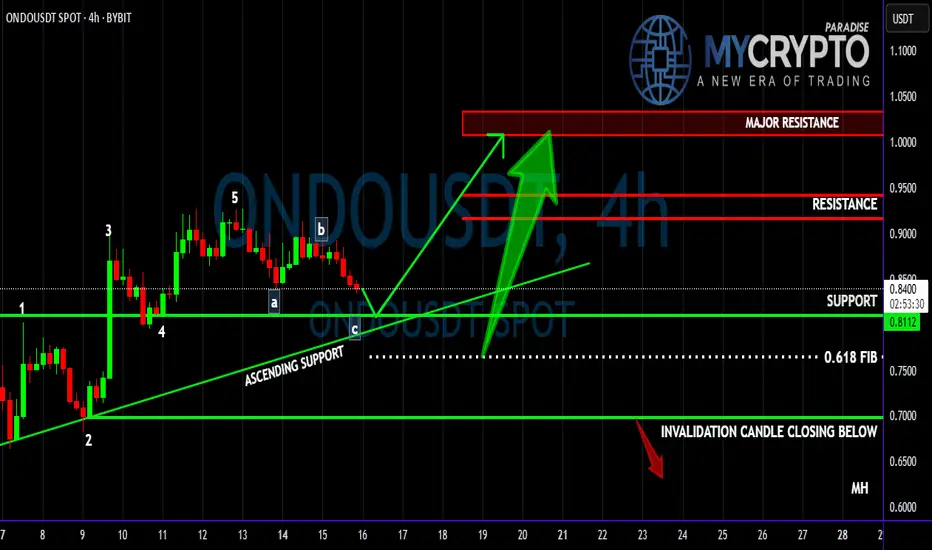
Is ONDO About to Crash Before the Next Big Rally? Yello Paradisers, are you ready for the next big #ONDOUSDT move, or will you be caught off guard by the next dump? Let’s break down what’s really happening here before it’s too late.
💎#ONDOUSDT has been following a clear Elliott Wave impulse structure. After completing the 5th wave of the impulse move, we’ve now entered the corrective phase. So far, the A and B waves have already played out, and now the C wave seems to be on its way — likely heading toward a key support area around 0.8112.
💎This support level is not just psychological — it also aligns perfectly with a well-respected ascending trendline, giving the level even more technical confluence. If buyers step in strongly here, this could be the launching point for the next impulsive bullish leg.
💎However, if the 0.8112 zone fails to hold, there’s a high probability we could see a deeper correction — potentially down toward the 0.618 Fibonacci level. This would still be a technically valid correction and might attract even stronger buying interest.
💎On the flip side, confirmation of bullish continuation would come once the pair regains momentum from the support zone and pushes towards the higher resistance levels. Watch closely for reactions in those zones — they will dictate the strength of the next leg up.
💎The invalidation of this bullish structure would be confirmed if we get a candle close below 0.6967. This would mean a break below both the ascending trendline and the 2nd wave of the Elliott impulse — a clear sign to reassess the structure.
Strive for consistency, not quick profits. Treat the market as a businessman, not as a gambler. Stay sharp and follow the structure — it's unfolding right in front of us, Paradisers.
MyCryptoParadise
iFeel the success🌴
FARTCOIN Is About to Make or Break—Massive Correction Incoming ?Yello Paradisers — have you seen what’s brewing on #FARTCOINUSDT? After our spot-on predictions in previous waves, this might be the final shakeout before the real show begins. But one wrong move here… and it all falls apart.
💎#FARTCOIN has recently shown aggressive movement, completing the third wave of a classic Elliott Wave impulse. Waves 1 and 2 are in place, and with the third now printed, there's a strong probability of entering an ABC corrective phase — forming the 4th wave — which could retest areas near the previous resistance-turned-support.
💎Zooming out, the asset has been shaping a long-term Cup and Handle formation, and while we’ve seen a breakout above the neckline, a retest is highly likely before any continuation. This aligns with a potential ABC structure, adding confluence to a possible pullback scenario.
💎On top of that, FARTCOIN is flashing signs of strength within a bullish inverted Head and Shoulders pattern, with a neckline around 0.6273. A retest of this key level is probable and would further validate buyer interest in this zone.
💎Additional confluence comes from Holding the multi-timeframe EMA 20 as dynamic support. A visible order block at the 0.618 Fibonacci golden pocket (0.5217), which could act as a magnet for price during the correction.
💎If this area holds, the bullish case remains intact, with probable targets at 0.8913, and an extended move into the 1.0542–1.1361 zone. However, this structure would be invalidated on a candle close below the right shoulder, or a breakdown below the 2nd Elliott Wave low.
This is the point where the weak hands get shaken out and smart money reloads. If you're aiming for long-term success, wait for high-probability setups and protect your capital. Strive for consistency, not quick profits. Treat the market as a businessman, not as a gambler, Paradisers.
MyCryptoParadise
iFeel the success🌴

Is TIA About to Break Down Hard? Traders Beware Before It’s lateYello, Paradisers! Did you catch the recent bullish rally on #TIAUSDT? It’s been delivering solid gains over the past couple of days, giving traders reason to celebrate. But what if we told you that this rally might just be setting up a classic trap—one that smart money is already preparing to take advantage of? The technical structure forming right now suggests a high probability of a reversal, and if you’re not paying attention, you might end up on the wrong side of the move.
💎#TIAUSDT, at the core of setup is a developing a probable Bearish Gartley pattern. These harmonic structures are rare but extremely powerful when they align with multiple technical confirmations and that’s exactly what we’re seeing here. With the recent move upward, TIAUSDT appears to have completed its C leg, a critical part of the Gartley structure. This sets the stage for the D leg, which typically completes much lower. The price reacted strongly from the C leg area, which also happens to line up perfectly with a previous local high adding even more probability to the resistance at that zone.
💎This resistance isn't just horizontal there's a dynamic element at play as well. The 21-period EMA on multiple timeframes is currently acting as a ceiling for price action. When a key moving average starts rejecting price repeatedly, it often signals that the current trend is losing steam and this dynamic resistance only strengthens the case for a downside move from here.
💎Looking deeper, the bearish signs are confirmed by momentum indicators. The RSI on lower timeframes is not only overbought but also showing clear signs of bearish divergence. This divergence occurs when the price continues to make higher highs while RSI starts forming lower highs a classic sign that momentum is weakening. It’s one of the more reliable early warnings that a reversal may be near. In this case, RSI is flashing that warning now, suggesting that buyers may soon run out of fuel.
💎If this bearish probable scenario plays out as expected, the first key level to watch on the downside sits around the 3.278 zone. This minor support may offer a temporary bounce, but if the D leg of the Gartley is to be completed, we could see even deeper price action. This makes the current area extremely sensitive—any weakness from bulls could trigger a fast move downward.
💎However, no pattern is complete without an invalidation level, and for the Bearish Gartley, that comes in around the 3.805 resistance zone. A strong, sustained close above this level would invalidate the bearish setup and signal renewed bullish momentum. Until then, all technical signals are pointing toward caution, especially for those still riding long positions without a tight risk plan.
Stay alert, Paradisers. The market is about to decide. This is a textbook moment where emotions can take over, and late buyers get punished for chasing green candles. That’s why, we are playing it safe right now. If you want to be consistently profitable, you need to be extremely patient and always wait only for the best, highest probability trading opportunities.
MyCryptoParadise
iFeel the success🌴

HNTUSDT Setting Up for a Breakout? Don’t Miss This MoveYello, Paradisers! what if one of the quietest altcoins on the board right now is actually setting up for a move that could catch most retail traders off guard? While the market’s been focused on noisy large caps, #HNTUSDT has been silently showing strength, forming a healthy bullish structure, and reclaiming key technical levels. We've been closely tracking its behavior across multiple timeframes—and the signs are becoming too strong to ignore.
💎#HNT has recently flipped a lower timeframe resistance into clean support, a classic early probable indicator that bulls are gaining control. What adds more credibility to the setup is the formation of a bullish market structure, marked clearly by consistent higher highs and higher lows. This is not just a short-term bounce. The pair has also broken out of a long-standing descending resistance trendline, a breakout that many likely underestimated. What's even more important is how the price has been respecting this broken trendline ever since, turning previous resistance into dynamic support—which is a textbook sign of a trend reversal gaining traction.
💎Zooming out slightly, the pair has also reclaimed a critical medium-term resistance zone, now acting as solid support. This is another strong bullish probability because it shows that buyers are stepping in with confidence at levels where they previously struggled.
💎The 1H chart further confirms the momentum, with clear market structure continuing to form, and the price now respecting multi-timeframe EMA-12. Historically, this EMA has acted as a pivot point for HNTUSDT whenever price has maintained above it, impulsive upside movements followed. So the fact that it’s currently being respected again adds confluence to the bullish probability building here.
💎To strengthen the case even further, the RSI is flashing a hidden bullish divergence, which tends to appear during retracements in strong uptrends and often precedes continuation moves. This subtle yet powerful signal is often ignored by inexperienced traders, but when spotted at the right time like now it can greatly enhance the probability of catching the next leg up.
💎From a resistance perspective, we’re watching two zones closely. The first significant area of supply sits between $3.85 and $4.02—a potential short-term barrier where some profit-taking might occur. However, if the bulls continue to defend the current structure and push through this level, the next major resistance lies between $4.40 and $4.55, which could offer a stronger reaction and potential rejection point
💎As always, we need to remain strategic. The invalidation of this bullish outlook would occur with a candle close below the key trendline and support region at $2.708. That’s where structure breaks down, and the probability flips against us. Until then, this is a high-probability setup that aligns well with both technical structure and momentum indicators.
Strive for consistency, not quick profits. Treat the market as a businessman, not as a gambler. Be patient, stay alert, and follow the setup with discipline—because this is how we win long-term, Paradisers.
MyCryptoParadise
iFeel the success🌴

AUCTION Is Breaking Down—More Pain Ahead?Yello, Paradisers! #AUCTION has been under heavy selling pressure, just like the broader crypto market. The price action remains weak, and the recent break below its ascending trendline support confirms that buyers are losing control. This breakdown is a crucial signal that the bullish structure has been invalidated, and unless something changes, the probability of further downside remains high.
💎#AUCTIONUSDT is trading just below this broken trendline, which has now flipped into a resistance zone, making it difficult for buyers to reclaim lost ground.Adding to the bearish momentum, the previous support level has now turned into a strong resistance, creating another obstacle for any potential recovery. The more a level gets tested as resistance after a breakdown, the stronger it becomes.
💎On top of that, there is an additional trendline resistance, meaning that even if AUCTION attempts a push upward, it will face multiple rejection points before any significant breakout can occur. This kind of price action suggests that sellers are still in control, and buying pressure is not strong enough to force a reversal.
💎Further reinforcing this bearish outlook is the 1D 12EMA, which is now acting as a dynamic resistance. Moving averages like this often act as barriers in downtrends, preventing price recoveries and leading to further declines. Additionally, the Multi-Timeframe VWAP (Quarterly) is also aligning with these resistance areas, making it even more challenging for AUCTION to break above these levels. When multiple technical indicators confirm the same resistance zones, it significantly increases the probability of the market rejecting any bullish attempts and continuing lower.
💎Another critical factor supporting the bearish thesis is the Fibonacci retracement level, which is also acting as resistance. This means that even from a retracement perspective, the price is struggling to move higher and remains capped under key technical levels. With all these resistances stacked against AUCTION, it is no surprise that the probability of a further downward move is increasing.
💎If the selling pressure persists, the next major downside target lies between $10.20 - $9.60, a key support area that could provide temporary relief. However, if bearish momentum continues, we must be prepared for a deeper correction, with the next significant support zone sitting between $8.85 - $8.30. These levels are crucial to monitor because they represent areas where buyers might step in to slow down the decline.
💎That said, there is one key level that could invalidate this bearish outlook—a 4H candle closing above $14.48. If AUCTION manages to break and hold above this level, it would indicate that buyers are regaining strength, and we could start reconsidering a shift in market structure. Until then, the trend remains bearish, and the higher probability play is to the downside.
The market is ruthless right now, and only traders who stick to disciplined strategies will come out on top. If you want to be among the winners, don’t let emotions dictate your trades—wait for the highest probability setups and execute with precision. Stay patient, stay smart, and make sure you’re on the right side of the trade, Paradisers!
MyCryptoParadise
iFeel the success🌴

SEI/USDT: Bullish Butterfly in Play – Will This Support Hold ?Yello, Paradisers! Are you keeping a close eye on #SEIUSDT? This pair has been quietly forming a Bullish Butterfly pattern, and we’re sitting right on the critical D leg support. But remember, it’s not all sunshine – there are some key resistance levels ahead, and the market isn’t always forgiving if you lose focus.
💎#SEIUSDT has completed the XABCD leg structure of the Butterfly pattern perfectly, and we’re now resting on the D leg, a crucial support zone. On higher timeframes, this level has held strong, suggesting a probable potential bullish bounce from here.
💎The Major Support Zone is around 0.3328.This level aligns with the X leg of the Bullish Butterfly pattern. It’s a critical price floor, and as long as SEIUSDT stays above it, bulls have a strong probability to regain control and push prices upward.
💎SEIUSDT is currently sitting on the D leg of the pattern, which is acting as a secondary support. This level has already shown strength on higher timeframes, giving bullish momentum a chance to sustain from here.
💎The first minor resistance zone is coming up soon. Watch for a candle close above this level to confirm bullish continuation.If SEIUSDT clears that, the next resistance is at 0.5934 to 0.6126, followed by a stronger zone between 0.7120 to 0.7364.These levels could offer significant opportunities for bulls, but they won’t be easy to break through without strong volume.
💎The pattern invalidates if the price closes below the X leg at 0.3328.If that happens, it’s a warning sign that the bullish structure has failed, and a deeper retracement could follow.
💎Stay disciplined, Paradisers. The Bullish Butterfly pattern is a promising setup, but patience is key. Watch how SEIUSDT behaves at the upcoming resistance zones, and wait for confirmations before making moves.
Trading isn’t about chasing every pump – it’s about positioning yourself where the probabilities are in your favor. Let’s trade smart and avoid getting caught on the wrong side of the market.Play it safe, Paradisers. The market rewards patience and discipline. Focus on the bigger picture, and you’ll stay ahead of 90% of traders out there.
MyCryptoParadise
iFeel the success🌴

OrderUSDT: Is the Bullish Breakout for Real? Don’t Miss !Yello Paradisers! Are you ready for what could be the next big move? #OrderUSDT is flexing some serious strength compared to the rest of the market. But is it all hype, or are we on the verge of something significant? Let’s break it down.
💎#OrderUSDT has shattered a descending trendline it was stuck in for days. The breakout wasn’t just clean—it’s already retested on lower time frame as well, showing strong probability for sustained upside.After being crushed in a downtrend, the pair has shifted gears into an uptrend. That’s right, Paradisers: higher highs are back on the table.
💎The probability is high for the upside move as A critical resistance zone was flipped into support after formation of double bottom below at support zone. This spot is holding strong and could become the springboard for the next move up.
💎If OrderUSDT pulls back, look for the previous resistance-turned-support zone around $0.22-$0.23.A deeper retracement could test the descending trendline, now a key support near $0.20-$0.21.
💎The next critical resistance zone for OrderUSDT lies between $0.27 and $0.2751, a level that will likely test the strength of the current bullish momentum. A successful break and hold above this area could pave the way for a continuation toward the next significant hurdle at $0.295 to $0.30. Clearing this upper range would not only solidify the bullish structure but also signal the potential for an even stronger upward move, drawing increased market participation and setting the stage for higher targets in the near future.
💎If the pair fails to hold support and drops below $0.18, this would invalidate the bullish scenario and signal a potential return to bearish action.
💎This market loves to shake out the weak hands before making its real move. A pullback here might just be the perfect opportunity to position yourself smartly. But remember: discipline is key. Don’t rush—wait for confirmations at key levels.
Stay sharp, Paradisers. This market isn’t for the faint of heart—but for those who stay disciplined, the rewards can be game-changing. Let’s crush it!
MyCryptoParadise
iFeel the success🌴

Is TAIKOUSDT Setting Up for a Bullish Breakout?Yello Paradisers ! #TAIKOUSDT is demonstrating impressive resilience amidst the market-wide dump, maintaining its position at critical support levels. Could this be the calm before the storm, signaling a significant move ahead? Let’s break it down.
💎#TAIKO has been trading above its crucial support zone for days, forming a stable foundation.This robust base suggests a strong probability of upward momentum.
💎The pair recently broke out of a descending trendline, retested it successfully on lower timeframes, and is showing early signs of strength.However, the market structure is still in flux, and a complete shift is yet to occur.
💎A pullback to the trendline is possible before any sustained upside move. This would allow the price to gather strength for its next leg up.
💎TAIKO is now trading just above the quarterly VWAP, which acts as a strong dynamic support. This adds confluence to the bullish narrative, suggesting that bulls are active and preparing for an upward push.
💎Immediate resistance lies at $2.32–$2.39. Once flipped into support, this could pave the way for a push towards the next significant resistance at $2.79–$2.88.
💎For the bullish scenario to remain valid, the price must hold above the major support zone. A decisive candle close below this level could signal a shift in momentum and invalidate the upside potential.
💎TAIKO's near-term trajectory will depend heavily on how it handles the retests of key support and resistance zones. A breakout above resistance could trigger a strong rally, while failure to hold critical levels might indicate more downside pressure.
💎As always, patience and discipline are key. The market rewards those who wait for clear confirmations before taking action. Will TAIKO achieve a bullish structure shift and outperform the market? Time will tell, but the signs are promising.
Consistency, patience, and strategic execution are the keys to long-term success. Remember, Paradisers, trading is a game of probabilities, not guarantees. Stay disciplined, and let the market come to you. Always wait for the best setups.
MyCryptoParadise
iFeel the success🌴
