BAKEBTC Faces Critical Support💎#BAKEBTC is currently exhibiting robustly bullish price dynamics. A keen examination reveals a recurring pattern: the price consistently breaches the downtrend trendlines on the daily chart, signaling a sustained long-term uptrend.
💎At present, the price finds itself sandwiched between the supply and demand zones, predominantly trading at the lower boundary of this range. Of particular significance is the resilience of the 61.8% Fibonacci level, which has served as a robust support level, with the price hovering just above it for the past five days.
💎This pattern significantly augments the likelihood of an impending upward movement. If this materializes, the price could potentially ascend just beyond the supply zone, with a target set on the 127.2% Fibonacci retracement level. However, it's essential to remain cautious as long as the minor resistance at 430 satoshis remains unconquered by the bulls.
💎Should this resistance fail to yield to the bullish momentum, the downside risk persists. In such a scenario, the breach of the 61.8% Fibonacci support would set #BAKE on a continued downward trajectory, with its sights potentially fixed on the 78.6% Fibonacci support level.
MCP

SOLUSDT Price Challenge - Support and Resistance in Focus💎At present, #SOLUSDT exhibits a well-defined uptrend, characterized by the consistent formation of higher lows and higher highs. This pattern signifies a healthy upward trajectory. Moreover, a recent clean bounce off the uptrend trendline reaffirms the prevailing uptrend sentiment.
💎However, as we analyze the price action, it's imperative to consider both support and resistance levels. Notably, the $17.33 support level has demonstrated resilience and has been respected by the market. This support level acts as a crucial foundation for the ongoing uptrend.
💎On the flip side, we also need to keep a close eye on resistance levels. The Volume Profile resistance, situated at $20.67, is proving to be a formidable barrier. This price action suggests an ongoing short-term consolidation phase.
💎Another aspect to consider is that #Solana remains within the confines of a descending channel. This channel introduces an element of risk for further downward movement. As a result, bulls should maintain vigilant watchfulness over the descending channel and the Volume Profile resistance for signs of a potential breakout.
💎In the event of a breakout, #SOL may experience a swift ascent towards the 61.8% Fibonacci level at the psychologically significant price point of $27.00. It's worth noting that this level has previously shown indications of supply, serving as a significant price zone.
💎In summary, for #SOLUSDT and many other cryptocurrencies, the current phase calls for patience. It often emerges as the winning strategy. As we navigate this waiting period, diligent monitoring of key support and resistance levels is essential. 🕒

Examining HBARBTC Trend💎In the world of cryptocurrencies, #HBARBTC stands out as one of the coins that has managed to maintain a valid uptrend against Bitcoin. This distinction becomes evident when we observe the price consistently staying above the uptrend trendline. Currently, it's intriguing to see that the price is testing this trendline once again. This area holds the interest of buyers, although it's worth noting that it carries a degree of risk. Paradisers, always remember that patience and careful analysis are your allies in trading.
💎Adding to this, during the current month, we've witnessed a noteworthy development—a clean bounce off the 200 Simple Moving Average (SMA) on the daily chart. This moving average has effectively marked the 205 Satoshis level as a significant resistance point. While the temptation to buy may be strong, it's often wiser to await an upside breakout before taking action. At MCP, we will steadfastly monitor this prevailing resistance and exercise patience as we await a potential breakout.
💎In the event of a breakout, a new realm of opportunities emerges. We anticipate that, should such a breakout occur, #HBARBTC will set its sights on one of the double Fibonacci resistance levels, as clearly marked on the chart. However, in the mid-term, the coin is still navigating through a consolidation phase. The future holds the answer as to which direction this breakout will take us.

FLMBTC Next Bullish Signals💎A few weeks ago, #FLMBTC accomplished a significant feat by closing above a critical supply zone on the weekly chart, hinting at the possibility of a bullish reversal. However, it's crucial to exercise caution and seek further confirmations to enhance the probability of this outlook. Specifically, the MCP team is closely monitoring the current demand area. Should this area hold, it could pave the way for an upward surge, breaking through several pivotal resistance indicators. These key resistance points include the 50 Simple Moving Average (SMA), the downtrend trendline, and the Volume Profile resistance.
💎A notable observation is that all these resistance indicators have acted as formidable barriers during potential upward rallies. Therefore, the next significant bullish signal would be the breach of both the 50 SMA and the downtrend trendline. Subsequently, surmounting the Volume Profile resistance at 544 Satoshis would be a decisive turning point, potentially ushering in a long-term bullish trend. In such a scenario, we anticipate #FLM to embark on a journey towards the double Fibonacci resistance level around the 900 Satoshis area, signifying a remarkable 200% increase against #Bitcoin.
💎However, it's imperative to maintain a watchful eye on the current demand area, particularly on the weekly timeframe. If the weekly closing price dips below the critical level of 308 Satoshis, it would raise concerns of a prolonged downtrend or an extended consolidation phase.

NEOBTC: Exploring the Road to a Strong Long-Term UptrendToday, we will analyze the #NEOBTC pair, which is displaying promising signs of a potential bottom formation and a reversal in its long-term trend.
💎First and foremost, Paradisers, we want to draw your attention to the current demand area located near 0.0002776 BTC. Since September 10th, this support level has undergone two tests, and it's evident that this level has been respected. While this doesn't confirm that NEO's price has reached its bottom, such price action is noteworthy and often indicates the potential for a significant move in the near future.
💎However, for us to reasonably expect a strong upside move, #NEO must breach the 23.6% Fibonacci resistance. This level is of utmost importance and can be described as a critical resistance point. Historically, it has functioned as both a demand and supply zone. Currently, it coincides with the 200 Exponential Moving Average on the daily chart.
💎Going forward, the MCP team will closely monitor the price action of #NEO against #BTC, patiently awaiting an upside breakout. When and if #NEOBTC confidently breaks above the 0.0003286 BTC level, we will seriously consider a long-term buying opportunity. Such a breakout would likely indicate that NEO is poised to outperform Bitcoin and potentially ascend towards the 61.8% Fibonacci resistance.
💎Nonetheless, the rally might not conclude at this point, for if the price surges beyond the 61.8% resistance, the next target could be as high as 0.0007480 BTC. This level represents a double Fibonacci resistance, which could be regarded as the final upside target in the event of a sustained rally.
Stay tuned as we closely follow #NEOBTC's journey, ready to seize potential opportunities and keep you informed of significant developments! 🚀📈

#ELAUSDT's Path to 115% Upside Potential💎#ELAUSDT is currently in the process of forming an extensive triangle pattern when examined on the 3D chart. This pattern exhibits the diligent respect for the uptrend trendline on the downside and the recognition of the supply zone around $2.07 on the upside.
💎A prominent development that has garnered our attention is the precise rebound from the 88.6% Fibonacci support level at $0.87. Remarkably, this bounce aligns almost perfectly with the Volume Profile level. Concurrently, when we consider the 50 Simple Moving Average (SMA), the price has consistently maintained trading above it, with the 50 SMA often acting as a reliable support.
💎At the present moment, #Elastos has once again descended close to the 50 SMA. Given the indication of a clean bounce from the Fibonacci support and the historical significance of the 50 SMA as a buying area, the probability tilts favorably towards an impending upward move.
💎The nearest resistance point is evidently the supply zone near $2.07. However, should this level be overcome by the buyers, the potential for a substantial price increase becomes apparent. The ultimate upside target rests near the 88.6% Fibonacci resistance level. Should this resistance level be reached, it would signify a remarkable 115% growth for #ELAUSDT.
💎Currently, the MCP team's focus is honed in on the price action surrounding the 50 SMA. As long as the price maintains its position above this level, the bulls are likely to maintain control. Subsequently, as the price begins to ascend, our attention will shift towards the supply area, which we anticipate may transform into a demand zone. At this juncture, the buying opportunity may manifest with heightened probability.
💎Amidst the positive aspects for #Elastos, it's essential to acknowledge the potential for an extended consolidation phase, where the price will undergo retesting of the uptrend trendline. Conversely, the worst-case scenario would materialize if the price breaches below the 88.6% Fibonacci support, thereby invalidating this bullish outlook.

WAVESUSDT Mid-Term Forecast💎 Paradisers, let's delve into the intriguing realm of #WAVESUSDT, where the market has woven a tale of wide-ranging price dynamics throughout the year. Within this narrative, we encounter distinct boundaries—a formidable resistance zone dwelling near the psychological fortress of $3.00 and the emergence of a compelling double bottom formation, nestled around the $1.25 territory.
💎Notably, recent developments have brought us to a pivotal juncture. #WAVES found support around the 88.6% Fibonacci retracement level. Simultaneously, price action revealed a remarkable bounce off the downtrend trendline. The significance lies in this trendline's transformation, transitioning from a resistance to a supportive force in our journey.
💎 Presently, our charts tell a tale of a minor 88.6% Fibonacci level at $1.486, serving as a sturdy bulwark of support. It's within this context that our demand zone comes into focus, nestled comfortably between these two Fibonacci retracement levels, spanning from $1.40 to $1.50.
💎 As long as #WAVES remains above this defined demand zone and maintains its connection with the uptrend trendline, our perspective leans toward a mid-term upward trajectory. While the exact duration remains uncertain, this path could potentially yield a 28% price increase in the weeks ahead. Paradisers, remember that patience and discipline are your allies during the waiting game.
💎 Rest assured, the MCP team will continue to vigilantly monitor the price action, ever watchful for potential shifts in market dynamics. We are committed to providing you with timely updates that empower your trading decisions.
Stay engaged, stay informed, and let's navigate this #WAVESUSDT journey together with confidence and knowledge! 🌊

#TRUUSDT's Potential Uptrend with Fibonacci Play💎Today's spotlight is on #TRUUSDT. The token has recently anchored its support at the $0.030 mark, aligning nearly perfectly with the 78.6% Fibonacci retracement level. Before this stabilization, #TRU sketched out a double bottom pattern. This pattern, followed by a surge past the local resistance, hints at a possible trend reversal.
💎 What does this mean for traders? The scales now seem to tip towards an upward correction. As long as the price stays comfortably above the double bottom region, specifically above the $0.026 trough, we can anticipate a robust upward pullback.
💎 On the resistance front, our eyes are set on another 78.6% Fibonacci retracement level at $0.037. This level intriguingly mirrors the downtrend trendline, making it a key point of interest.
💎 However, a word of caution: The MCP team remains vigilant about today's low, marked by the Fibonacci bounce. A descent below this point might cast shadows on the prospective upward correction.

RNDRUSDT Promising Trajectory💎 On May 19th, #RNDRUSDT reached its highest point in 400 days, testing the $2.95 level. However, what followed was a persistent decline, resulting in a substantial 57% drop.
💎 A noteworthy aspect of this decline is the price action surrounding the 61.8% Fibonacci support level. Bulls have demonstrated resilience in defending this critical level. Simultaneously, a bullish divergence pattern has emerged on the MACD indicator, hinting at a potential trend reversal.
💎 Adding to the positive developments, last week witnessed a decisive breakthrough above the downtrend trendline by #RNDR. This represents another significant piece of the price action puzzle.
💎 With these factors combined, it becomes plausible to consider that the probability of an uptrend has significantly increased. As long as #RNDRUSDT maintains its foothold above the current support area, the prospect of a sustained long-term uptrend remains intact.
💎 A formidable resistance barrier looms at the psychologically significant level of $3.00, coinciding with the 161.8% Fibonacci retracement level. This implies substantial upside potential, amounting to nearly 140%. However, it's essential to recognize that such a robust move may unfold over weeks, if not months.

Triangle Breakout Signals Bullish Momentum for RUNEUSDT💎 Since its low in June, #RUNEUSDT has demonstrated impressive strength, boasting a remarkable 140% price surge. This performance places it among the top performers in recent times. Notably, the price journey broke free from a descending channel, catapulting from $1 to the psychological resistance at $2.
💎 Following this substantial upward move, a consolidation phase ensued. During this period, #RUNE established robust support at $1.385, corresponding to the 38.2% Fibonacci retracement level. Within the confines of this consolidation, a triangle pattern took shape. Recently, #RUNE decisively breached the upper boundary of this triangle, signaling a robust bullish sentiment.
💎 Simultaneously, the breakout extended beyond the confines of the previous descending channel. This demonstrated a compelling surge in buying pressure. As a result, it's reasonable to assume that the overall trend remains bullish. According to Elliott Wave theory, there appears to be potential for at least one more upward wave.
💎 Evaluating the factors at play, including the strength of the preceding uptrend, the presence of trendline resistance, and the 161.8% Fibonacci retracement level, we can anticipate #RUNE's next move. There is a high probability of #RUNEUSDT aiming for the $2.434 resistance area in the near future.
💎 Nevertheless, Paradisers, it's essential to remain prepared for potential range-trading and even short-term pullbacks before the uptrend fully resumes. Given the recent pace of growth, any uptrend resumption is likely to be relatively swift.

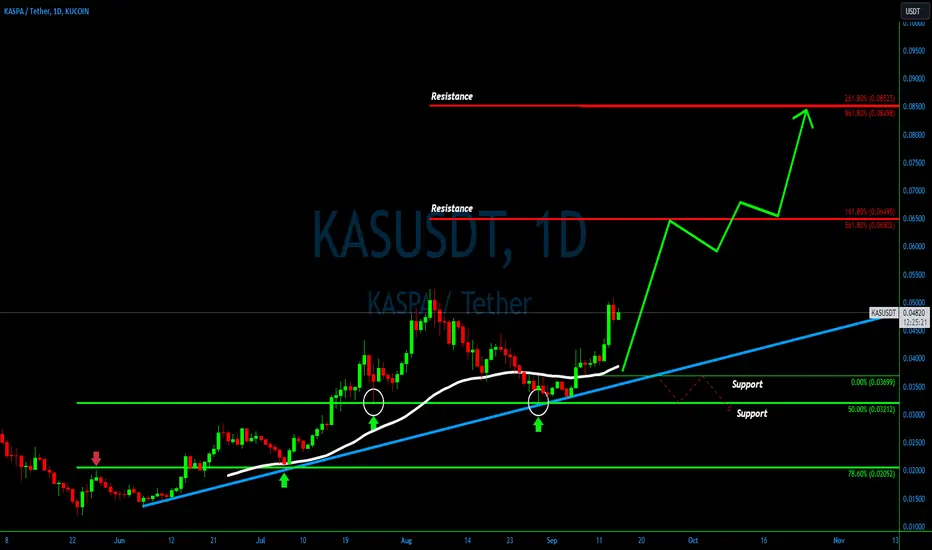
Charting the Path - KASUSDT Uptrend Story💎#KASUSDT has recently delivered an impressive performance, marking an almost 60% price surge since the month's commencement. This upward trajectory initiated following a bounce from the 50% Fibonacci support level at $0.032. Simultaneously, we observed a decisive rejection of the long-term uptrend trendline. These two pivotal events propelled the price upward, breaching the 50 Exponential Moving Average on the daily chart.
💎This price action underscores the credibility of a robust uptrend, significantly enhancing the likelihood of further growth. Consequently, #KASPA is poised to set its sights on one of the double Fibonacci resistance levels, situated at either $0.065 or $0.085.
💎However, prudent traders, or Paradisers as we like to call them, remain vigilant for opportune buying moments amidst the ascent. They avoid chasing the asset at its peak. Simultaneously, it's imperative to prepare for the scenario in which the price breaks below the recent support at $0.036. Such an occurrence would cast doubt on the continuation of the uptrend.
💎In light of these factors, implementing a sound money management strategy alongside clearly defined support and resistance levels is imperative for a well-rounded approach to trading.
The Power of Three - NEOUSDT Support Zone Study💎The #NEOUSDT daily chart has been exhibiting an intriguing price action pattern that's worth our attention. Of particular note is the remarkable resilience of the $6.76 support level, which has seen the price bounce off it three times consecutively. This support level coincides with the 78.6% Fibonacci retracement level, further enhancing its significance.
💎In recent days, #NEO has been on a consistent upward trajectory. Given the consistent respect for the support, the probability leans favorably towards a continuation of this upward movement.
💎For prospective buyers, it's essential to identify potential profit-taking areas. There are two notable levels of interest in this regard. The first is a minor resistance near the psychologically significant $8 level, which also aligns with a double Fibonacci level. Notably, bears have put up a strong defense in this price region, making it a likely initial profit-taking zone for buyers if the price continues to rise.
💎However, should this resistance level be breached, the prospect of an extended uptrend becomes more compelling. The next target for #NEOUSDT would be the $9 area, which holds significant importance. This zone corresponds to the 61.8% Fibonacci retracement level, the 200 Simple Moving Average, the long-term downtrend line, and the Volume Profile resistance.
💎For the MCP team, this constitutes a key price area to monitor closely, as a breakout above it could signal the initiation of a long-term uptrend. Nonetheless, Paradisers, it is imperative to continue monitoring the 78.6% Fibonacci support level. Any attempt by the price to breach this level should be regarded as a robust warning sign of a potential continuation of the downtrend.
🔍 Keep a watchful eye on these critical levels as the price action unfolds.

ASTRUSDT Uptrend Within the Ascending Channel💎For over 2 months, starting from the end of June, #ASTRUSDT has displayed consistent upward movement, firmly entrenched within an ascending channel. However, a pivotal development occurred on August 23 when the price decisively breached the upper boundary of this ascending channel. This breakthrough hinted at the potential for an accelerated uptrend. Nevertheless, in the wake of this upside breakout, a corrective phase unfolded over the course of 3 weeks, and it appears to be an ongoing process.
💎What demands our attention at this juncture is the current price testing the lower boundary of the channel once more. This test is occurring in proximity to a critical demand zone, which interestingly served as a supply zone in the past. In the realm of probabilities, mathematics speaks volumes, and buyers should be keenly aware of the emerging risk-to-reward opportunity.
💎As long as the price remains above the demand zone, the MCP team anticipates a resurgence in price. A robust confirmation of an uptrend, in our view, would manifest with a break above the recent high at $0.0614. Such an event would trigger our quest for an opportune entry point. Subsequent to the breakout, we anticipate the price gravitating towards one of the double Fibonacci resistance levels, as depicted on the chart. Notably, the second resistance level aligns with the upper boundary of the extended ascending channel and could serve as a profit-taking region should the uptrend persist.
💎Paradisers, we remain vigilant for the establishment of a new higher high, a development that would likely usher in the next phase of the uptrend.

5 Weeks of Unwavering Support for VeChain (VETUSDT)💎Turning our focus to the #VETUSDT weekly chart, it becomes evident that recent price movements have piqued our interest. Over the past year, #VET has maintained a tight range, primarily hovering around the $0.015 support area. During this extended period, it has formed what appears to be a compelling triple bottom pattern, and the most recent bounce off this crucial demand zone has occurred consistently over the past five weeks. This remarkable resilience suggests strong defense by the bulls and amplifies the potential for an imminent upside breakout.
💎As we delve deeper into the chart, we note that #VET has now approached a long-term downtrend trendline. Intriguingly, this trendline, when combined with recent price action, forms a triangle pattern—a classic signal of impending volatility. Maintaining a cautious yet optimistic stance, we keep a close eye on the current support area, anticipating a potential breakout above the downtrend trendline. This critical juncture could witness a substantial shift in market sentiment, with the possibility of this breakout occurring on either the daily or weekly timeframe.
💎Envisioning a bullish scenario, should the breakout materialize as expected, #VETUSDT would likely embark on a northbound trajectory, setting its sights on the nearest Supply Area around $0.0216. Such a substantial price surge would signify a robust 50% increase for the #VeChain community, reinforcing the significance of these potential developments.
💎While the path to the upside appears promising, it's prudent to acknowledge that the closest resistance area coincides with the 50 Exponential Moving Average (EMA). This confluence highlights the importance of this supply zone and underscores its potential role as a significant hurdle for price advancement.
💎In conclusion, while we eagerly await the long-awaited upside breakout, we advocate for a cautious and prepared approach. The recent pattern of consistent defense of the support zone indicates a strong foundation for potential bullish momentum. However, it is essential not to rush into positions prematurely. Maintaining readiness for various market scenarios, including the possibility of a price retracement, is crucial. Paradisers, remember that prudent and informed actions based on confirmed price action are key in navigating this intriguing landscape.

INJUSDT Double Bottom - A Potential Game Changer💎 #INJUSDT has recently formed a double bottom near the $6.2 support. But, at the same time, the downtrend trendline is holding strong, suggesting that bears are still in control. 🐻
💎 However, the presence of a potential double bottom introduces the possibility of a sentiment shift from bearish to bullish if we witness a decisive 4-hour break and close above the trendline. This could be a game-changer Paradisers. 🎮
💎 In the event of a clear 4-hour breakout above the trendline, #INJUSDT may embark on an upward journey toward the nearest supply zone, located around the psychologically significant $8 resistance. If we break above this zone, it could magically transform into a demand area, setting the stage for further growth. 🪄
💎 In this optimistic scenario, #INJUSDT might set its sights on the next supply zone, which, this time, is situated at the $10 psychological resistance level. Paradise team members should be prepared for this exciting possibility. 🚀
💎 Overall, the outlook seems to favor the formation of a bottom. However, we must remain vigilant and ensure that no new lower lows are printed, as a downside breakout would once again affirm bearish dominance. 🚫🐻

LPTUSDT Bullish Flag formation💎 A Promising Start: #LPTUSDT has drawn our attention with recent price action, notably finding support at the 78.6% Fibonacci retracement level.
💎 Long-Term Bullish Trend: Compared to most cryptos, #LPT maintains a strong long-term bullish trajectory, increasing the potential for further growth.
💎 Flag Formation: Over the past week, a Bullish Flag pattern has emerged, followed by an upside breakout. This can suggest a continuation of the uptrend, and the MCP team is poised for a buying opportunity.
💎 Resistance Ahead: The closest resistance lies at the 127.2% Fibonacci retracement level, which, if reached, would complete the Bullish Flag pattern.
💎 Prepared for Consolidation: While the uptrend could resume at any time, we must also be prepared for extended consolidation. Crucially, the price must stay above the descending channel's lower boundary, which acts as the downtrend support trendline.
💎 Key Support Zone: The critical support zone remains at the 78.6% Fibonacci level. A breach below this level would prompt a change in our sentiment.

40% Uptick in Sight for ASTRUSDT ?💎 On the daily logarithmic chart, yesterday #ASTRUSDT showcased a precise bounce off its uptrend trendline. This behavior is consistent with the bullish trend that has been evident since June.
💎 The demand zone, which is of paramount importance, has remained steadfast. This zone is possibly where bullish traders have been actively accumulating over the past two days. Its resilience is a testament to its significance in shaping future price movements.
💎 It's crucial to emphasize the pivotal role of the current demand zone. If this zone continues to be staunchly defended by the bulls, we could very well witness a surge in the price by as much as 40%. Such a move would be a significant leap, underscoring the zone's importance in dictating the trajectory of #ASTRUSDT.

Navigating the #TOTAL Market Cap: A Glimpse into Crypto's Future💎The overall health of the cryptocurrency market can be gauged by examining the #TOTAL Market Cap, making it an essential chart for traders and investors. Delving into the #TOTAL weekly chart, the long-term perspective remains optimistic. Notably, the downtrend trendline representing the average price has been breached, accompanied by the formation of a new Higher High. Such developments hint at a potential transition from a bearish to a bullish trend.
💎Post-breakout, the market entered a consolidation phase lasting four months. During this period, the price oscillated between the 1.235T resistance and the 1.000T support. Currently, #TOTAL is undergoing a retest of the significant 1 Trillion mark, which aligns with the Volume Profile support, reinforcing its importance. If this Demand Zone remains unbreached, we might be on the cusp of a substantial 60% surge, targeting the 1.6T resistance. The strength of this resistance is underscored by its alignment with the 327.2% and 38.2% Fibonacci retracement levels.
💎It's worth noting that making long trades now could be akin to catching a falling knife. Nonetheless, our objective at the MCP team is to highlight these pivotal market shifts. By doing so, we hope to empower you to discern bullish indicators promptly, ensuring you maintain a competitive edge in your trading decisions.

INJUSDT's Bullish Potential: Awaiting the Decisive Breakout💎 Today, we're turning our focus to the #INJUSDT chart, where a distinct bounce from the Fibonacci support has caught our eye. If you glance at the chart, you'll notice the 427.2% Fibonacci level was decisively repelled on August 23. This bounce catalyzed a brief rally, propelling the price towards the 227.2% Fibonacci resistance, which coincidentally aligns with the significant $8.00 mark.
💎 Interestingly, this Fibonacci resistance dovetails with the Volume Profile resistance, marking it as a pivotal juncture for #INJ. Currently, the price is oscillating between these support and resistance thresholds. A decisive breakout, either upwards or downwards, is essential to forecast the next phase of price movement.
💎 On a side note, we've observed an upward breach of the descending channel, lending further weight to a potential bullish trajectory. However, it's a precarious time for bullish traders. The optimal strategy might be to bide time, awaiting a surge past the $8.00 barrier and the descending trendline. A clear breach of these markers would underscore the bullish momentum. Until then, our primary task is to vigilantly track any breakout, regardless of its direction.

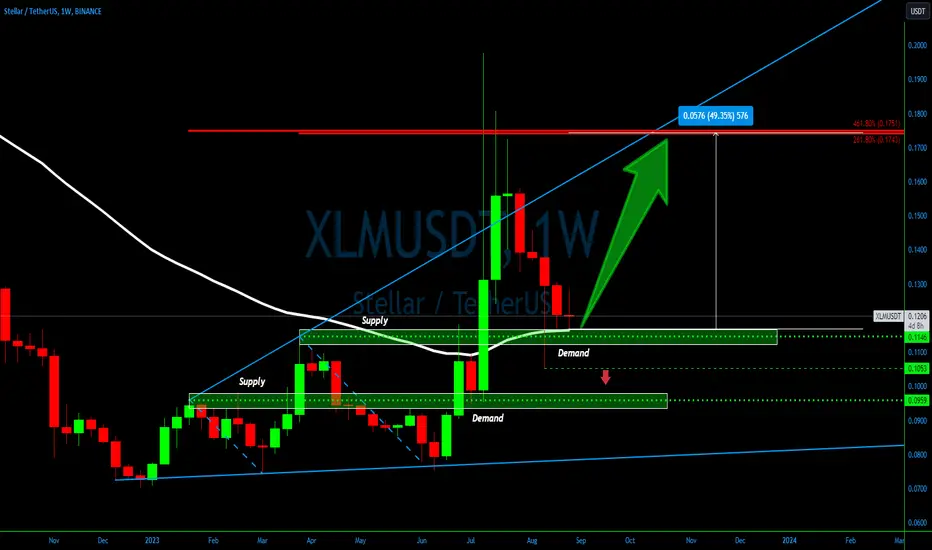
Unpacking XLMUSDT Price Patterns💎 Diving into #Stellar's long-term price trajectory, we spot some captivating patterns. The weekly #XLMUSDT chart reveals the price nestled in a robust demand zone, a magnet for buyers. Moreover, the 200 Exponential Moving Average has been consistently rebuffed in the past weeks.
💎 The bullish uptrend is evident with the formation of LLs and LHs. Given #XLM's position at support, it hints at a promising risk-reward scenario for bullish traders. As long as the price hovers above the current demand zone and crucially, remains north of the recent low at $0.1053, the scales tip towards an uptrend continuation.
💎 Eyeing the upside, a formidable resistance looms at $0.1750, marking a 50% surge from the present rate. This resistance's potency is amplified by a dual Fibonacci level, specifically at 261.8% and 461.8%. We could witness either a swift rally or an extended consolidation before #XLMUSDT ascends. In this volatile dance, patience and discipline remain our steadfast partners.
ROSEUSDT: Analyzing the Latest Shifts💎 #ROSEUSDT remains confined within a descending channel, underscoring the ongoing downtrend. Yet, a noteworthy development is its recent rebound from the channel's bottom, essentially bouncing off the support trendline.
💎 Concurrently, there's a clear rejection at the 127.2% Fibonacci support, pegged at $0.0357. These bullish indicators merit attention, hinting at a potential robust upward correction.
💎 However, we term it a 'correction' since a genuine trend reversal demands more substantial evidence. A pivotal sign would be breaking above the descending channel. For now, we anticipate an upward correction, contingent on the price surpassing the supply zone around $0.0457.
💎 If achieved, this resistance could transform into support, paving the way for bullish action. In such a scenario, the target might be the channel's top, aligning with the 38.2% Fibonacci resistance.
💎 Conversely, if the proximate supply zone remains intact, the bearish risk persists. A definitive descent below the channel would signal a prolonged downtrend.

MKRUSDT Bullish Pathway Unveiled💎 Elliot Wave Theory Insights: Based on the Elliot Wave theory, #MKRUSDT's primary trend leans bullish. We've observed a sequence of a 5-Wave upward movement, succeeded by an ABC correction pattern.
💎 Potential Wave Completion: This suggests that the initial major upward wave might have concluded, with the price now gearing up for the second significant wave.
💎 Consistent Retracement Patterns: Examining the retracements post each wave, a consistent pattern emerges: the first retracement halted around the 38.2% Fibonacci level, the second around 50%, and the current one near 61.8%.
💎 End of Correction Phase: Given this trend and the potential ABC structure, there's a heightened likelihood that the corrective phase is nearing its conclusion.
💎 Bullish Confirmation: For validation, #MKR needs to surge past the descending channel, propelled by robust buying momentum. Such a move would be a robust indication of the bulls reclaiming dominance.
💎 Price Target Projections: Should the trend turn upward, we anticipate the price targeting the 161.8% resistance, positioned at the pivotal $1600 mark. This suggests a potential price augmentation of roughly 55% from the existing support level.

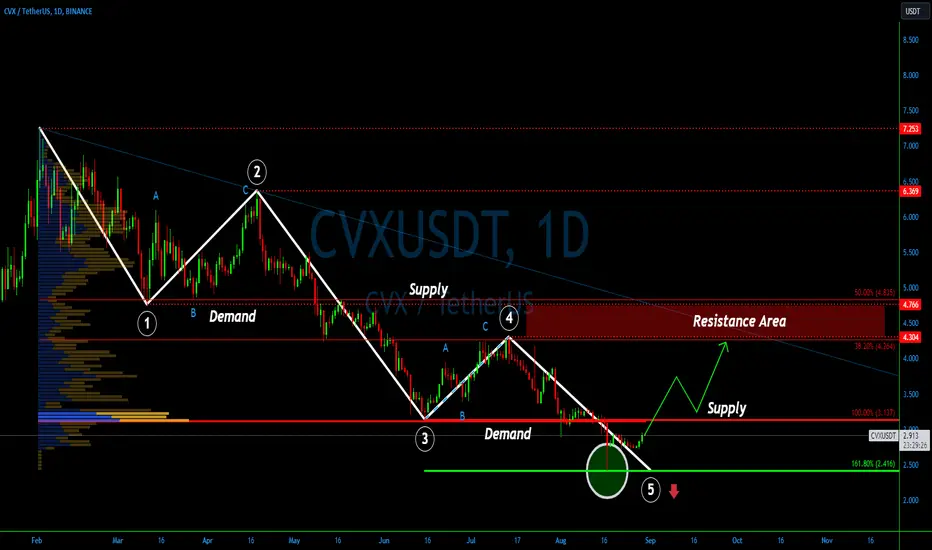
CVXUSDT Story through the Elliot Wave Lens💎The #CVXUSDT chart is currently painting a fascinating narrative, reminiscent of the classic Elliot Wave theory. Since the dawn of this year, the asset has witnessed a consistent dip. Between February and August, #CVX plummeted by a staggering 66.6%, leaving investors pondering about its future prospects.
💎However, there's a silver lining for the optimists. A few weeks ago, #CVX might have wrapped up its 5th downward wave, signaling the end of the Elliot Wave cycle. This speculation stems from the impeccable bounce off the 161.8% Fibonacci support, precisely at $2.416. Such a move often heralds a potential shift in the long-term trend, and our team is gearing up to respond.
💎Our next milestone? We're keenly observing the $3.13 supply zone, which previously played the role of a demand area. A confident breach above this threshold could see it morph back into a support zone, paving the way for a bullish trajectory. If this transformation occurs, #CVX might embark on an upward journey, possibly targeting the resistance bracket of $4.26 - $4.83. This could translate to a potential 50% price surge in the forthcoming weeks. But remember, this is just the initial resistance; there's room for the price to soar by 100% or even more.
For those eager to stay abreast of the evolving #CVX landscape, keep your eyes peeled for our updates.