GoldGold after big rally now enter in Consolidation or correction zone.
2424/2454 major Resistance.
If not close above we seen profit booking.
Min. 2 to 10%
MCX

MCX ready to run higher and higherBuy high and sell higher works when momentum is working one way. That seems to be the case for MCX right now. A classic bullish flag pattern breakoutThe stock is trading at highs but the momentum shows strength to soar higher
Entry - 3637
SL - 3445
Tgt - 3934

MCX Pole & Flag BreakoutMCX pole and flag breakout is on chart.
Levels marked on chart.
If you didn't take this trade but at least keep this in your watchlist to observe how this chart pattern work in real environments.

Falling wedge | Bullish Flag | Swing | Trend lineGold weekly is in bull(Impulse wave already in move).
4H timeframe :: There is falling wedge pattern
Falling Wedge :: TP : 2091.10
SL : 2013.39
D timeframe :: There is a swing and bullish flag.
bullish flag :: TP : 2166.70
SL : 2013.39
Swing :: TP : 2133.75
SL : 2013.39
The CMP has taken support of 4H ascending trend line pattern.

XAUUSD - Gold is making 4th breakout attemptGOLD is making 4th breakout attempt. If it does breakout this time, then I expect another 20% move making it to reach $2500 levels.
Keep an eye!

MCX - Stock Analysis🚀 **Strategic Stock Pick: MCX - STWP View**
📈 **PriceVol**: *Bullish*
- *Last Few Sessions*: Rising Price Accompanied by Increasing Volume
🔥 **OneDay**: *Strong Bullish*
- *Latest Tick*: Vigorous Price Surge Supported by Strong Volume
📊 **Donchian Bands**: *Strong Bullish*
- *Trending Up*: Consecutive New Highs Indicate a Robust Uptrend
📈 **Daily Chart**: *Bullish*
- *Heikin Ashi Pattern*: Bullish Continuation Pattern Identified
📅 **Weekly Analysis**: *Bullish*
- *Heikin Ashi Pattern*: Bullish Continuation, Indicating Positive Momentum
🗓 **Monthly Outlook**: *Strong Bullish*
- *Candlestick Pattern*: Bullish Marubozu at a High Level, Suggesting Strong Momentum
🚀 **Trade Recommendation**:
- **Go Long above**: ₹2785
- **Stop Loss**: ₹2431
🌟 *Unlock the potential for substantial gains with MCX! Seize the opportunity and position yourself for success.*

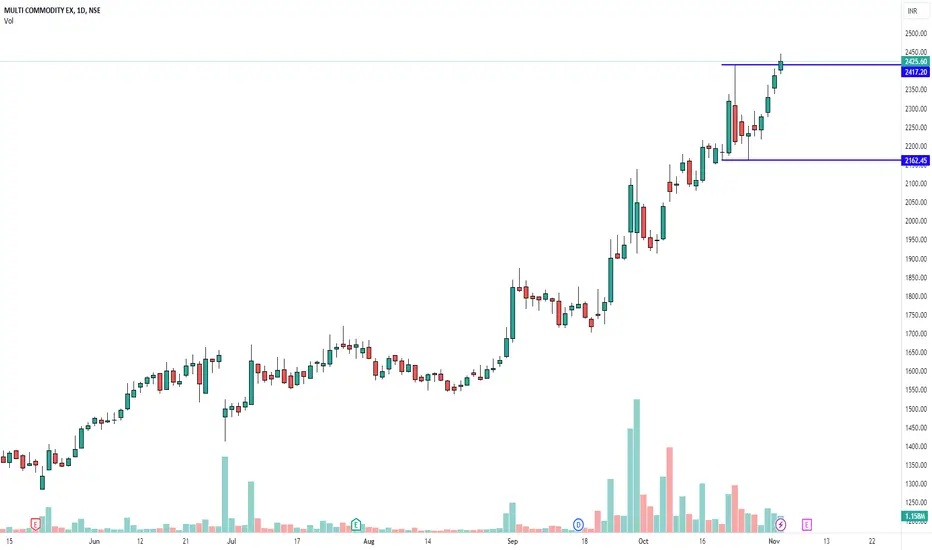
MCX - Stock AnalysisMulti Commodity Exchange of India Ltd. (MCX) is displaying a strong technical and fundamental profile, making it an attractive option for investors.
From a technical perspective, the stock exhibits several positive signals. The PriceVol indicator is "Mild Bullish," cautioning that while the price has been rising, the volume may not fully support this trend. The HighLow indicator is "Bullish," indicating that the stock has made a new one-year high.
The one-day analysis is "Mild Bullish," with the latest tick showing a mild price rise. It's advised to keep a close eye on the volume. The Parabolic SAR (PSAR) is "Bullish" with a bullish crossover and is sustaining the trend. The KeltnerBand, DonchianBand, MAEnvelopeBand, HighLowBand, MAChannelBand, RsiSmooth, ADX (Average Directional Index), and HighLowMABand all exhibit "Strong Bullish" signals, indicating positive breakouts and strong trends.
Candlestick patterns on the daily, weekly, and monthly charts all reflect "Bullish" sentiment, highlighting positive market sentiment.
From a fundamental perspective, MCX demonstrates several strengths. The company's Book Value has been trending upward over the last three years, indicating a strong financial position. There is excellent net margin performance over the last three years, reflecting healthy profitability. MCX is earning an excess return, and all key Trailing Twelve Months Margins have grown by 15%.
The Piotroski F Score is at a stable value of 4.0, suggesting sound financial health. The company maintains a good net margin of 23.10%, indicating strong profitability. However, it offers a very low dividend yield of 0.820%, indicating a preference for reinvesting profits for growth.
MCX has achieved annual sales growth for three consecutive years, and quarterly sales over the last five years are trending upward. Additionally, there is a steady increase in Total Assets over the last three years, reflecting the company's consistent growth and financial stability.
In summary, Multi Commodity Exchange of India Ltd. (MCX) presents an appealing investment opportunity with strong technical and fundamental indicators. The stock's bullish technical signals, combined with its robust financial performance, make it an attractive choice for investors seeking growth potential in the market. Nevertheless, investors should stay vigilant and monitor both technical and fundamental developments for a comprehensive understanding of the stock's potential.
Go Long above 2447.10
Stop Loss 2191
#NATURALGAS LONG TRADE IDEA SETUPGreetings Folks,
today i have prepared a setup of NATURAL GAS on MCX
the analysis is as follows
- the price is looking for a minor reversal
- currently trading at a very important zone
- wait for a retest for entry
dont play with fire, always use a predefined stoploss

#MCX... Looking good for 21.07.23#MCX...
Intraday as well as swing trade
All levels given in charts ...
IF good potential seen then we work in options also
if activate then possible a good movement Keep eye on this ...
We take trade only when it activates...
Possible to give good target
TRADING FACTS

natural gas levelsTechnical levels for NATURALGAS (MCX)
==== Technical Levels ====
Buy Above : 227.00
T1 : 232.46
T2 : 237.57
T3 : 239.50
SL : 222.41
Sell Below : 222.41
T1 : 217.46
T2 : 212.58
T3 : 210.76
SL : 227.41

natural gas july futureTechnical Levels
Buy Above: 223.00
T1: 228.34
T2: 233.41
T3: 235.32
SL: 218.38
Sell Below: 218.38
T1: 213.48
T2: 208.64
T3: 206.84
SL: 223.33

natural gas july monthnatural gas july month levels for 26-06-2023
Technical Levels
Buy Above: 224.00
T1: 229.51
T2: 234.59
T3: 236.51
SL: 219.52
Sell Below: 219.52
T1: 214.61
T2: 209.76
T3: 207.95
SL: 224.49

natural gas levelsBuy Above: 214.00
T1: 219.09
T2: 224.05
T3: 225.92
SL: 209.33
Sell Below: 209.33
T1: 204.54
T2: 199.80
T3: 198.03
SL: 214.18

Gold's Chart Signals Temporary Downtrend but Uptrend Indicators As per the analysis of the provided chart, the outlook for Gold suggests potential downside towards the levels of 59260 , 59000 , and 58700 . Traders should pay attention to the level of 59600 , as a crossover and close above this level could signal a resumption of the uptrend. The presence of the 100-day moving average and a parallel channel on the chart further support the notion of an underlying uptrend, indicating that the current downtrend may be temporary.
In terms of key events for today, the following are of significance:
18:00 Core PCE Price Index (MoM) (Apr) and Core Durable Goods Orders (MoM) (Apr) - High impact
19:30 Michigan Consumer Expectations & Sentiment (May) - Low impact
22:30 U.S. Baker Hughes Oil Rig Count - Medium impact
Additional information and important event details for the upcoming week will be provided shortly.

natural gas technical levelsBuy Above: 209.00
T1: 213.70
T2: 218.60
T3: 220.45
SL: 204.06
Sell Below: 204.06
T1: 199.33
T2: 194.65
T3: 192.91
SL: 208.85

natural gasbuy above green line and sell below red line....target and stop loss is in next line draw.

MCX Buy Levels 18 May 2023As per my analysis, NSE:MCX is indicating reversal. My idea is to take buy entry at level of 1365 with stop loss of 1330. My expected upside target would be 1385 & 1465.
Note: This is my personal analysis, only to learn stock market behavior. Thanks.

MCX - Bullish Swing ReversalNSE: MCX is closing with a bullish swing reversal candle supported with volumes.
Today's volumes and candlestick formation indicates strong demand and stock should move to previous swing highs in the coming days.
The stock has been moving along the horizontal support for the past few days which is indicating demand.
One can look for a 8% to 12% gain on deployed capital in this swing trade.
The view is to be discarded in the event of the stock breaking previous swing low.
#NSEindia #Trading #StockMarketindia #Tradingview #SwingTrade
Disclaimer:
This is for educational purposes only.

Silver's Price Outlook: Targets for Uptrend and Downtrend ScenarThe resistance level at 67160 is a critical level for silver's trend, as it will determine whether the current uptrend will continue or a downtrend may be expected. If the price manages to break and sustain above the resistance level, it suggests a continuation of the uptrend, with potential upside targets at 68360 , 68760 , and even as high as 69300+ .
However, it's important to note that these targets are not guaranteed and depend on the price's ability to overcome the resistance level. On the other hand, if the price fails to break above the resistance, we may expect a potential downtrend. In this scenario, downside targets may include 65600 and 65060 below the critical resistance level.

MCX Multi commodity exchange this stock is now trading in TRIANGLE pattern waiting for the clear breakout. This pattern is showing in 1hr time frame. Purely intraday strategy. This is not any call or recommendation this is my study purpose analysis.

MCX MULTI COMMODITY INDEXMCX day chart
Support zone is 1425
Nearly resistance is swing high which is 1698
buy when price comes to near support zone 1430

Silver on SHARK Silver has shark on daily timefram with perfect BC resiprocal. lets wait for swap and retest for final target.

Naturalgas on reversalNaturalgas on reversal due to cypher completion and also as per RTM a very good level to long now.
