MCX for Swing.Buy only small qty if market is not stable.
Can keep booking partial for the given targets.
MCX

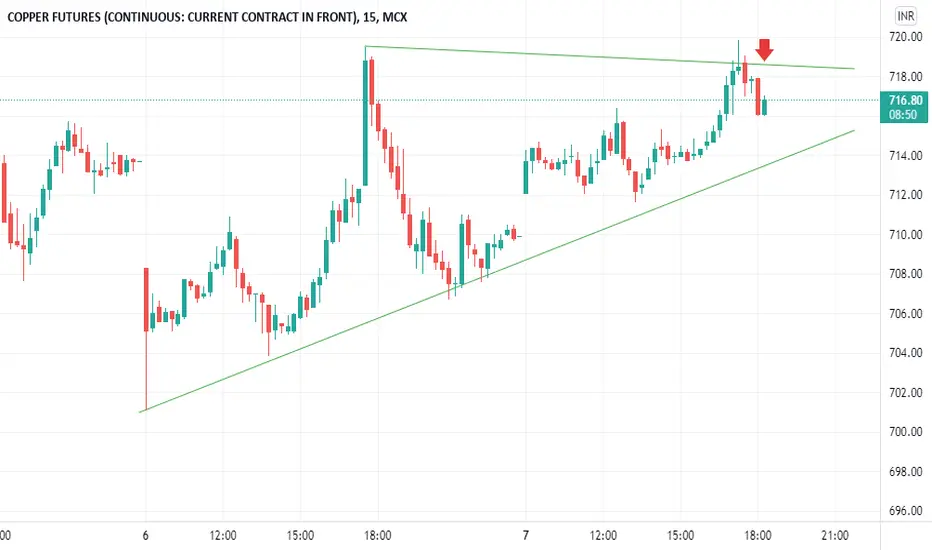
Copper Futures Reversal TradeIt has reached the lower trendline and looks to reverse by taking support. Going Long would be a good idea. Target is placed Near Resistance, Stop Loss is placed below trendlines, support zones and 200 EMA.

Silver is in side waysThe white metal Silver seems in side ways.
59,000 is a good support per trend lines and 64,500 to 65,000 will be the selling levels.
Buy on low is recommended

MCX Silver Short It has reached the upper trendline and faces resistance, therefore may undergo price correction. This would be a good opportunity to short Silver.
Risk Reward Ratio - 3:1

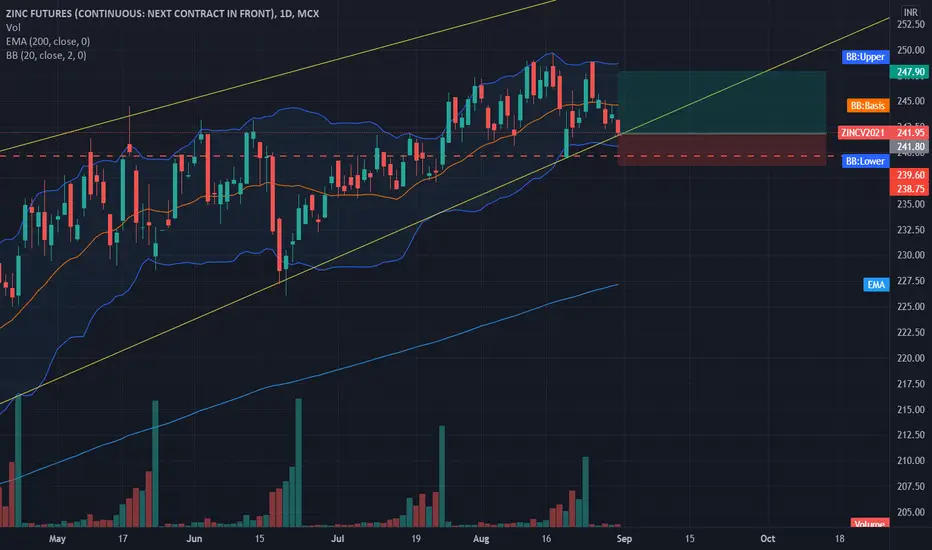
Zinc | Bullish sign for this Winter 2021MCX - Zinc offers 2 opportunity to ride the bullish trend. From the seasonality historical data, it has been always witnessed that by the end of November price starts accumulating demand the demands of the market.
As represented in the above chart, wait for the price to come near our area of interest and wait for other bullish conformations.


Gold Price has broke out the long term trendline T1. Golden crossover of 50 and 200 SMA is formed. These are the strong bullish signs. But price is stuck below resistance level approx. 49080 to 49735. When price will break the resistance zone, after a confirmation we can go long above the level of 50000.
Hi there, I am publishing my technical analysis ideas for educational purpose. All the analysis that I share are basic and simple to understand specially for new traders.

GOLD - BULL FlagGOLD broke out of its resistance and consolidation and now its time for gold to rally. we will very soon see Gold running towards 60K INR.

Copper (MCX) Short Term ReversalThe commodity has reached upper trendline and may undergo a correction within range. Trade is supported by resistance Nearby.
Risk Reward Ratio - 2:1
SL is placed above resistance zone & the upper trendline. The target is placed near swing low.

MCX Crude oil LongMarket hold the price point .than market pull back to top zone
Long for Buy Indicate and Hold for you T on your mind
My opinion is Long on this price point and Your's

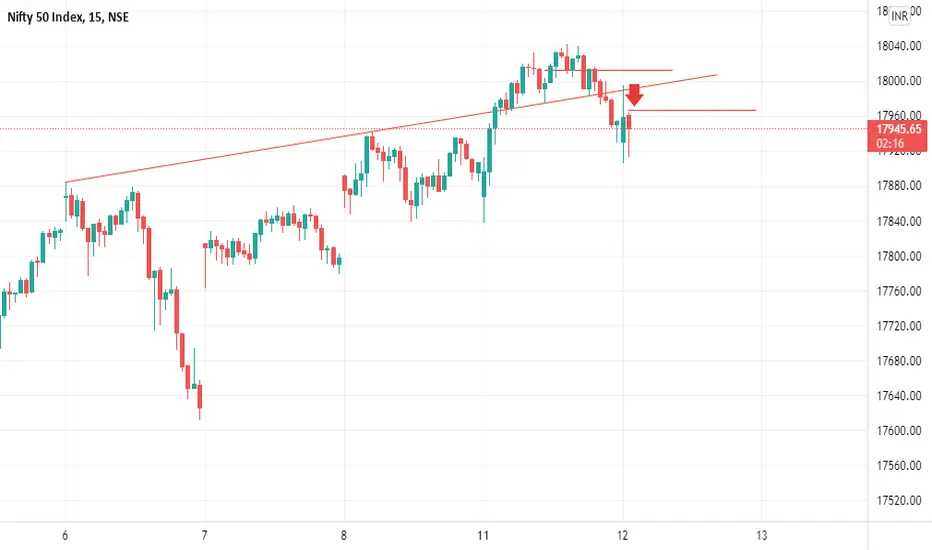
Nifty DownTomorrow Idea same continue .Market heated for High level Short my Level today is 17955-970
this is my opinion and your"s

MCX inside candle tradein mcx prices weekly time frame prices are floating from very long time in a inside candle i have highlighted everything
target is 2100 and sl is 1400 best of luck

Gold ReversalThe commodity has reached the upper trendline and the overall outlook looking bearish it is better to short.
With a good risk reward ratio of 3:1. Any breakout should trigger the SL.

MCX Copper Shortmarket over heat .Right time to short your position
every market lose own control for bull ..this time is copper
This is My Opinion and your's ?

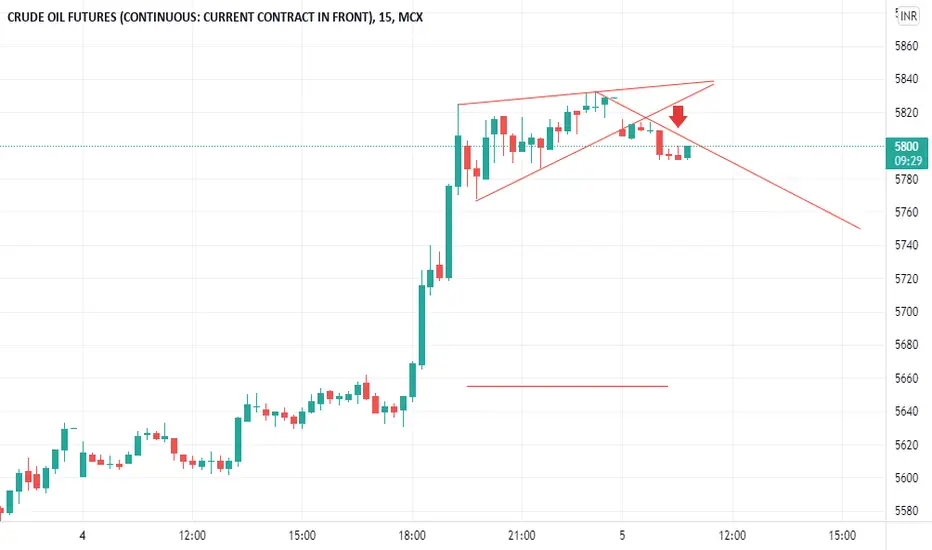
MCX CRUDEOILMarket Over bought .Market Down For at The Level SELL -
5800-5810 .I Think Market Down ..Comment Your Opinion
MCX is ready to flyCMP 1671 (Spot)
Entry 1650-1670
T1 1700
T2 1745
T3 1780
SL 1625 (Closing basis)
Throughout the recent fall in benchmark indices, MCX has been strong and positive.
Price is moving in a range on daily charts and today also it took a support on 20sma as well as the bottom of range.
If SL is safe, we can look for an upside of 5-7% in coming days. Keep an eye and trade safe.
Above 1800, sky is the limit.


Zinc (MCX) Short Term ReversalThe stock has reached the lower trend line and might take support and undergo a reversal rally. Trade is supported by Lower Trendline, Lower Bollinger Band and Supports Nearby.
Risk Reward Ratio - 2:1
SL is placed below support zone & the lower trendline. The target is placed near all time/swing high.
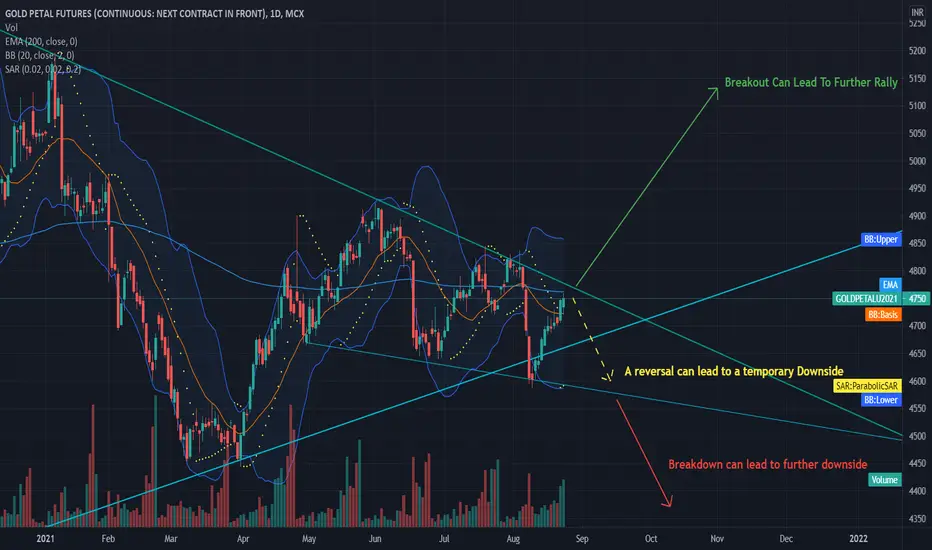
Gold (Petal) - India (MCX) Price AnalysisGold is at an important price point and its future price movements depend on whether it undergoes a breakout or a reversal. Enter a trade only after confirming a Breakout or Breakdown.
CRUDE SELL ON HIGH
this level was fully study
crude oil breck weekly level sell on high more info call now 07314090641

MCX taking support from previous breakout looking goodMCX looking good, taking support from previous breakout. Trend looks to be good for accumulation !!
