GOLD - Lovers Elliott wave - looking strong Short/Medium termGOLD-----Daily counts indicate Excellent bullish wave structure.
Both appear to be optimistic and this stock invalidation number (S L) wave 2 low
target short / long term are already shared as per charts
correction wave leg seems completed (C)
Investing in declines is a smart move for short/ long-term players.
Buy in DIPS recommended
Long-term investors prepare for strong returns over the next two to five years.
one of best counter
Every graphic used to comprehend & LEARN & understand the theory of Elliot waves, Harmonic waves, Gann Theory, and Time theory
Every chart is for educational purposes.
We have no accountability for your profit or loss.
Mcxgold

CFD Gold Chart Analysis: Wave 4 in FocusHello friends, let's analyze the Gold CFD chart from a technical perspective. As we can see, the higher degree Cycle Wave III (Red) has completed, and we're currently in Cycle degree Wave IV (Red). Within Wave IV, we expect a Primary Degree ((A)), ((B)), and ((C)) in Black. Wave ((A)) has completed, Wave ((B)) is almost complete, and Wave ((C)) is expected to follow.
Within Wave ((B)) in Black, we have Intermediate Degree Waves (A), (B), and (C) in Blue. Waves (A) and (B) are complete, and Wave (C) is nearing completion. Once Wave (C) in Blue completes, Wave ((B)) in Black will end, and Wave ((C)) in Black should begin.
According to theory, Wave ((A)) came down and then wave ((B)) retraced upwards so now Wave ((C)) should move downwards, forming a zigzag correction. The equality level is around $2858. However, we don't know if it will reach this level or extend/truncate.
The invalidation level for this view is 3169.23. If the price breaks above this level, our analysis will be invalidated.
This analysis is for educational purposes only and not trading advice. There's a risk of being completely wrong. Please consult your financial advisor before making any trades.
I am not Sebi registered analyst. My studies are for educational purpose only.
Please Consult your financial advisor before trading or investing.
I am not responsible for any kinds of your profits and your losses.
Most investors treat trading as a hobby because they have a full-time job doing something else.
However, If you treat trading like a business, it will pay you like a business.
If you treat like a hobby, hobbies don't pay, they cost you...!
Hope this post is helpful to community
Thanks
RK💕
Disclaimer and Risk Warning.
The analysis and discussion provided on in.tradingview.com is intended for educational purposes only and should not be relied upon for trading decisions. RK_Charts is not an investment adviser and the information provided here should not be taken as professional investment advice. Before buying or selling any investments, securities, or precious metals, it is recommended that you conduct your own due diligence. RK_Charts does not share in your profits and will not take responsibility for any losses you may incur. So Please Consult your financial advisor before trading or investing.

Breakout Confirmed! Gold’s Next Target Could Be $3,500+Gold has reached a new all-time high (ATH), signaling strong bullish momentum. The breakout above the long-term rising trendline, which previously acted as resistance, indicates a shift in market structure.
The resistance zone has now turned into support, confirming buyers' dominance. A minor pullback or retest of this breakout level could be expected before a stronger continuation to the upside.
If the price sustains above this zone, potential targets lie at $3,100-$3,200 in the short term and $3,500+ in the medium term.

MCX Gold intraday trend forecast for March 21, 2025I have a bearish outlook for the day. The first phase is bearish and then a pull back is likely to take place. This is my mathematically derived outcome. Use your technical analysis and trade with Stop-Loss.

Gold Trading Strategy for 16th December 2024Gold Trading Strategy
Buy Above: The high of the candle which closes above 2662 on a 15-minute chart
Sell Below: The low of the candle which closes below 2636 on a 15-minute chart
Risk Strategies:
Risk Strategy 1:
Sell between 2660-2666
Stop-Loss: 2675
Targets: 2648, 2636, 2619
Risk Strategy 2:
Buy between 2621-2617
Stop-Loss: 2608
Targets: 2636, 2648, 2660
Additional Tips:
Monitoring: Continuously monitor the 15-minute chart for clear buy or sell signals.
Risk Management: Always use stop-loss orders to manage risk and protect your capital.
Market Conditions: Stay updated on market news and events that could impact gold prices.
Disclaimer:
This analysis is for informational and educational purposes only. Please consult with a certified financial advisor before making any trading decisions.

World class accuracy - XAUUSD fall 2656 to 2600..2% fall ready..Xauusd sell mode start
Sell below 2656.30
Stop loss 2665...9 pts
Tp1....2650...6 pts
Tp2.....2640...16 pts
Tp3......2600.....56 pts.
More than 2% fall
This level only for education purpose

Sharf fall expect in xauusd 2607 to 2587....20 ptsXauusd sell below 2607
Stop loss......2618.50
Tp1........2602.....5pts
Tp2.........2596.....11 pts
Tp3..........2587.....20 pts
This levels only for education purpose only

Water fall in xauusd 2609 to 2587..22 ptsXauusd sell mode
Sell below 2609.20
Stop loss ....2616.....7 pts
Tp1......2604......5 pts
Tp2.......2596.....13 pts
Tp3.......2587......22 pts
This levels only for education purpose only

XAUUSD buy above 2513 to 2528--15 points21/08/2024
Xauusd strong buy above 2513
Stop loss 2507....6 pts
Target 1......2518.....5 pts
Target 2......2522....9 pts
Target 3......2528.....15 pts+++
This level only for education purpose only

Falling wedge | Bullish Flag | Swing | Trend lineGold weekly is in bull(Impulse wave already in move).
4H timeframe :: There is falling wedge pattern
Falling Wedge :: TP : 2091.10
SL : 2013.39
D timeframe :: There is a swing and bullish flag.
bullish flag :: TP : 2166.70
SL : 2013.39
Swing :: TP : 2133.75
SL : 2013.39
The CMP has taken support of 4H ascending trend line pattern.

Gold MCX 65000 Rs target readyHi
MCX gold future
may reach 65k
Fib leval mentioned check it
Great opportunity

Crude Oil Latest Strategy Trading Strategy
Through the analysis of the daily chart of crude oil, we know that the market continued to fluctuate in a short-term high and narrow range yesterday, and the upper part has been subject to the suppression of the 30 moving average. Judging from the three recent declines, there is less room for rebound each time. The strength of the negative line is relatively strong, and the current moving average system has been in a short position, and the MACD below has been running below the zero axis. The red bull energy column is smaller than the wave, indicating that the bulls have exhausted their actions, and there is a waterfall in the market. , It is a normal phenomenon. In the short term, we will continue to focus on the suppression of the 78.00 line above, and the pressure on the 80.00 line above. In terms of operation, we will continue to focus on shorting rallies. The specific suggestions are as follows:
Crude oil 77.90 and 80.20 are shorted respectively, the stop loss is 70 points, and the profit is 400 points
Crude oil 74.80 and 72.10 are long respectively, the stop loss is 70 points, and the profit is 200 points
MCX:CRUDEOIL1!

Gold Future Current MCX gold was making Rising Wedge pattern
today we are seeing breakdown
Now Selling Could Get activate after break 56500 (for confirmation)


Swing Trade Opportunity in GOLD ? Looks interesting!MCX:GOLD1!
TVC:GOLD
Hello Traders,
I see a good swing or small term trading opportunity in Gold at current price.
UPSIDE resistance is around Sell zone between 1879 - 1919 with SL below 1780
This is not a buy/sell recommendation, but my personal views. You're solely responsible of your profits n losses.
Regards,
Anshul.

Gold (MCX) Breakout & RetestGold Petal MCX ( Commodity ) has broken out and retested, therefore may undergo a reversal rally. Trade is supported by Supports Nearby.
Risk Reward Ratio - 2:1
SL is placed below the support zone & the lower trendline. The target is placed near resistance.

All That Glitters is GoldGold Looking to break out of the multi day resistance, will likely eat up all liquidity above these zones.

Don't Get Yourself Into a Bull Trap With MCX GoldKey levels: 47948 - 49290
Gold is rejecting uptrend and downtrend at the level of 47948 . And we don't see a powerful movement in the 2021 year, wherein it throwout the level of 49280 successfully.
Here, you will have a strong support level, wherein we may decide about buying or selling. And it is the level of 47948 . Intraday traders can keep buying the gold for targets of 48360 - 48640 - 48890 - 49280 until it remains above the level of 47948 .
But, if you see a breakout of the first 'key' level, then sell it for the targets of 47480 - 47060 below.
Buyers must be aware these days. Why?
The gold prices may push down with power compared to an uptrend because of Coronavirus (Omicron).
For advance traders, watch significant releases or events that may affect the movement of gold, silver, crude oil & natural gas.
Tuesday, Dec 28, 2021
20:30 CB Consumer Confidence (Dec) - High
Wednesday, Dec 29, 2021
03:00 API Weekly Crude Oil Stock - Medium
21:00 Crude Oil Inventories - High
Thursday, Dec 30, 2021
19:00 Initial Jobless Claims - High
21:00 Natural Gas Storage - Low

Zinc | Bullish sign for this Winter 2021MCX - Zinc offers 2 opportunity to ride the bullish trend. From the seasonality historical data, it has been always witnessed that by the end of November price starts accumulating demand the demands of the market.
As represented in the above chart, wait for the price to come near our area of interest and wait for other bullish conformations.

crude oil in monthly demand zoneBuy crude oil from 4800 and sL 4630
CRUDE IS IN GOOD DEMAND ZONE IT WILL GIVE YOU GOOD TARGET
ENTRY ON 4800
sL 4615
TARGET 5200
IF You Like plzz comment and share

GOLD - BULL FlagGOLD broke out of its resistance and consolidation and now its time for gold to rally. we will very soon see Gold running towards 60K INR.

Gold (Petal) - India (MCX) Price AnalysisGold is at an important price point and its future price movements depend on whether it undergoes a breakout or a reversal. Enter a trade only after confirming a Breakout or Breakdown.
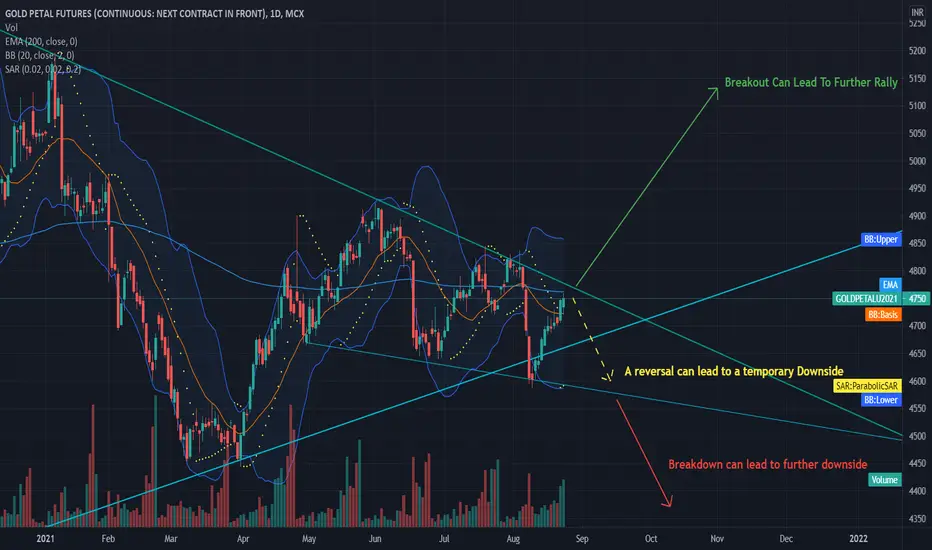
Price ActionTrend lines can be used to trade, if it closes beyond those trend lines trade can be taken respectively
