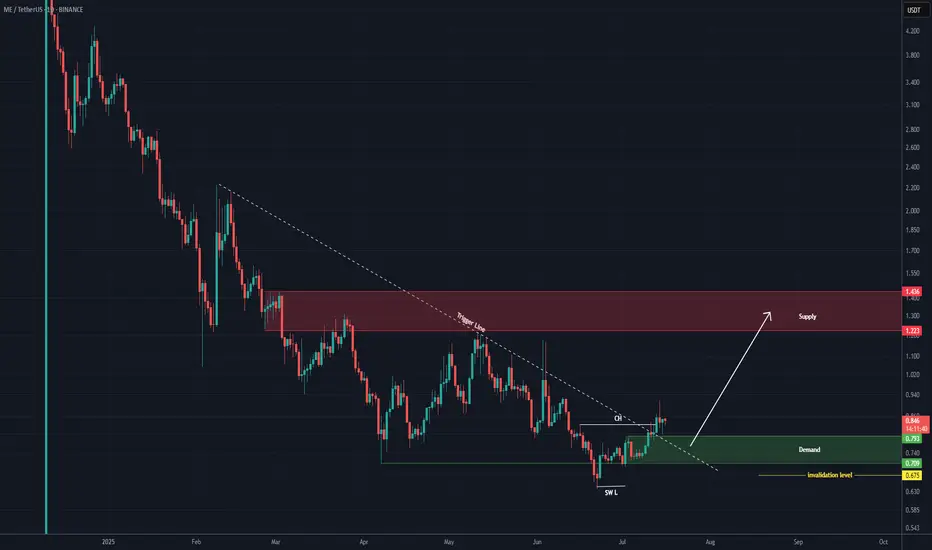
ME Analysis (1D)After holding above the support zone, we have a bullish Change of Character (CH) on the chart, which is a bullish sign. Additionally, the trigger line has been broken.
After a slight pullback, the price may move toward the targets.
The targets are marked on the chart.
A daily candle closing below the invalidation level will invalidate this analysis.
For risk management, please don't forget stop loss and capital management
When we reach the first target, save some profit and then change the stop to entry
Comment if you have any questions
Thank You
ME
Me !!!The price on the daily timeframe is within a triangle, which can create some uncertainty about which direction it will move. Here, we should wait to see which side of the triangle the price breaks out from. Remember, the trend is our friend.
Best regards CobraVanguard.💚

SEI Poised for a Breakout After Bold 23andMe Acquisition Bid !Sei (SEI), the innovative layer-1 blockchain designed for high-speed trading and decentralized finance (DeFi), is flashing strong bullish signals both fundamentally and technically. The recent news that the Sei Foundation is exploring the acquisition of 23andMe, the leading personal genomics company, has sparked excitement in the market. If successful, this strategic move could position Sei at the forefront of the multi-billion-dollar genomic data industry — combining blockchain’s security and transparency with the rapidly growing demand for data privacy.
Why This Is Huge
23andMe recently filed for Chapter 11 bankruptcy protection, opening the door for a potential buyout. The Sei Foundation’s plan to migrate genetic data onto the blockchain would give individuals direct control over their data, allowing them to decide how it’s used and even monetize it. This taps into a massive and underserved market where data security and privacy are becoming critical issues.
Bullish Chart Setup
From a technical perspective, Sei’s chart is showing signs of a major breakout:
✅ Double Bottom: SEI has recently formed a clear double bottom pattern, signaling a strong reversal from recent lows. This is a classic bullish pattern that suggests the selling pressure has been exhausted and buyers are stepping in.
✅ Falling Wedge: SEI is also breaking out of a falling wedge, a high-probability bullish formation. Falling wedges typically lead to strong upside moves as downward momentum fades and buying pressure builds up.
✅ Volume Increasing: Recent spikes in volume confirm that smart money could be accumulating in anticipation of a breakout.
Perfect Storm for a Rally
With a bullish technical setup aligning with a game-changing fundamental catalyst, Sei could be on the verge of a major breakout. A successful acquisition of 23andMe would not only give Sei real-world utility in the health data sector but also drive increased adoption and network activity. If SEI clears key resistance levels, this combination of technical strength and strategic growth could send the token to new highs.
Sei isn’t just another DeFi project — it's positioning itself to be a leader at the intersection of blockchain, health data, and privacy.
This could be the beginning of a powerful new trend for SEI. 🚀

MEUSDT Ready to Explode or Another Bull Trap?Yello, Paradisers! Are we about to witness a strong bullish reversal on MEUSDT, or is another trap being set? Let’s break it down.
💎MEUSDT has formed a well-structured ending diagonal with a clear 5-wave pattern, increasing the probability of an upcoming bullish move. Additionally, the inverse head & shoulders pattern, combined with bullish divergence, further supports a potential reversal. However, for confirmation, we need a decisive breakout and candle close above the key resistance zone to increase our odds.
💎In case of a retracement or panic selling, we are eyeing a bounce from the major support zone, where a potential double-bottom formation could play out. But to strengthen the bullish case, we need to see bullish I-CHoCH (Internal Change of Character) or a W-pattern forming on lower timeframes.
💎On the flip side, if MEUSDT breaks down and closes candle below the major support zone, it will invalidate our bullish outlook. In that scenario, waiting for stronger price action and a more favorable setup would be the best approach.
🎖Patience and strategy are key, Paradisers! Rushing into trades without confirmation is a sure way to get trapped. Play it smart, stay disciplined, and wait for high-probability setups. That’s how you win in this market!
MyCryptoParadise
iFeel the success🌴

$ME need to break downtrendAll eyes on BMV:ME if it can break that downtrend.
ME is a big player on SOL and they are preparing to launch their DEX soon.
I would start adding from here with a target of +15$

Price Action to accumulate Magic Eden before Explosion! -14.5M BMV:ME blocked on Staking
-46k Staker Users.
-First Stake Reward will be given in 3Months. (Unclaimed tokens 17M + 70M Airdrop)
Crash is slowing down, I start my accumulation phase at 2.80$ and I will keep making fractional buys if the price stays bettwen 2.80$ to 1.90$ where I do believe it will be the very DIP of BMV:ME

Magic Eden SWING LONGThe price has finally broken the downtrend line, signaling a possible shift in market structure. I plan to sell at $33, a level that aligns with the 1.618 Fibonacci extension.
Stop Loss: Below recent lows.
Maximum recommended leverage: x5.
for the moment the breakout is positive, a rally or increased volatility before reaching the target would not be surprising. Risk management remains crucial.

ME (Magic Eden) Bulls time!The ME chart is interesting, initially there was a lot of selling pressure from people who received the airdrop, causing the price to drop from $8 on Binance to $4.90, but it then made a double bottom near $ 5 and is now showing strength and trading above the moving averages on 15 minutes timeframe.
If volumes remain this high, I believe the price will rise in the coming days, I liked the risk reward.

ME - Long SetupLooking for break above 2.22, Would consider stop signal of 1.97, potential first target of 2.57, 2nd potential target 3.93 based on weekly downward channel. SMDI on daily and weekly. Small insider selling in Aug, Nov and December from 3 insiders but small % and $ size.

Gold buys after break of 1642.00 Daily/Weekly retracementWe have had our fun selling gold as i have but theres a lot of money to be made on both ends as i believe after the break of 1642.00 we can have lower timeframe retracements that can lead us all the way up to daily supply zones @ 1665.00. Still Bearish, just short term bullish IF break occurs. If not we can continue to sell gold to 1600 and lower.

false breakout at the 10$ level?technically, we have a false breakout from the 10$ level.
if we will have a summer rally in stocks, we can give it a try with a short on this pair


summer rally or no summer rally? $ASMLwell
$ASML is something that I bought at the beginning of this week.
the 43 correction from the top encouraged me to do so.
we don't care if the correction will go lower, because we are thinking in terms of decades

GBPUSD H1this my thesis on GBPUSD , lets see how this goes . i think the pound will hold well compared to the dollar based on techinals

BTC NEXT TARGET AND BEAR MARKET UPDATE 24/03/2022First post update: $ 33,000 threshold $ 35,000 is the largest support ever created. If I'm wrong, don't judge me, I just want to have a big party on a yacht listening to Danza Kuduro :)


$BTC daily time frame I was taught that when the price makes a false breakout from a channel, the price will retest the other side of the channel.
In this moment the price is not diverging(on this TF) and more downside looks promising.
I expect also a false breakout from the big channel/big fib level before continuing to the upside.
The green path drawn on the chart is a little exaggerated(but not impossible)
Crypto is not my happy place so don't believe what I'm saying :)

$nikkei k.i.s.s analysis looks like Nikkei likes a lot to trade in a range/to form channels
there are two possibilities in my humble opinion:
red path is the safest one: wait for the retest of the support and after that give it a try.
green path: if you believe that the stock market worldwide will have a sharp turnaround, combined with the support confluences.
if I add value to your trading path, please like this post and follow me :)


$audcad short o daily TFthe daily candle from yesterday looks very promising
also, we can find a break and retest on the hourly chart
the TP is around the 0.91109 price zone
remember that every trade is random :)

$EURCHF reversal zone?usually I am early to the party so I'm starting with small positions first;
lets see how the price will brake from the orange zone;
if we measure the previous moves, I believe that we are near the inflexion point;
the first zone to look at if we brake up is 1.05.
good luck!

$eurnzd, no brain weekly technical analysis it is interesting how this pair has these patterns
the down moves are nearly the same :)
trade safe!
