Low-risk, Predictable Speculation on VX FuturesA lot of traders I talk to are afraid of trading volatility products.
When I watch trading shows even the professionals are afraid of trading the VIX because they don't understand it.
I find that funny because as someone who has experience trading all asset classes and analyzing a dozen casino games I find the VIX to be the most mean-reverting asset.
The more an asset returns to its mean price, the more predictable it is, the more risk you can allocate to that product.
For instance the safest bet in the casino is around 48% probability of success. That bet is betting red or black in Roulette.
For investing there is no safe bet. We know that if you spread your dollars around in the S&P500 over the last 30 years, you would have done well but no one can predict which 10 stocks would have outperformed over the last 10 years.
I have probably analyzed several dozen indicators over several dozen securities across all the asset classes: crypto, stocks, bonds, etc.
For the last 30 years the VIX has had a flat bottom price average around 14-16 dollars.
Its top is around 30-40 dollars.
Comodities, equities, currencies, etc they all have black swan political or weather events. They are influenced by fear and lack. Why not trade the vehicle that correlates with fear? that's the VIX.
Humans are predictable. They will always go through cycles of fear.
Now we know the asset class but how do we measure the mean? I chose the Directional Trend Index but with a twist. the DTI takes 3 values to create the mean trend lines( R, S, and U) . I cycled through 1 to 50 permutations in all 3 values. It turns out that a reverse or descending numerical input is the best performing.
Now we have the asset: VX Future
The strategy: Reverse DTI with any descending number of your choice (10,5,3)
The indicator: VIX chart 4 hours: I was told by floor traders that the big money banks use 4 hour and daily charts for analysis. So I always trade on this to swim along the trend of the big fish.
So I open up a 4 hour chart of VIX, apply the pine script of DTI , update the R S and U values, and create a strategy.
It returned over 100% profit in the backtesting. I tried linking my chart screenshot for proof . hopefully this worked. this is my first post. :-)
TVC:VIX
I traded this on traderspost automated trading with $50k paper money and I made over $35000 in 90 day free trial.
Reach out to me if you would like to schedule a call for more help.
Meanreversion

$TSLA: Likely peaked for now...Tesla is stuck between a rock and a hard place, and the path going forward is likely mean reversion, price gravitating around the monthly mode area that sits below, with very well defined upper and lower barriers keeping price range bound for a while. Current short term setup is a short if price breaks into new lows on Monday pretty much, and we can already figure out the target for such action, but I would venture a guess that price needs to coil sideways next, before rallying higher over time, given fundamentals. I am cautious these days and rather trade swings, than try to hold long term positions stubbornly though. So, if you followed my last idea suggesting $TSLA was going through the last down swing before a bottom, now would be a decent time to secure gains or at least sell calls against holdings. Many ways to skin a cat, in this case the cat of volatility dampening. On the topic of guesswork, my long term guess for $TSLA was something like this, which I did when I talked about the first daily buy signal near 125.72:
The longest term trend in $TSLA has expired already, so we should expect sideways and volatile action for 8 half-year bars, that's a long a$$ time...
Best of luck!
Cheers,
Ivan Labrie.

How to be a Mean Reversion ScalperIn this video I go over how I trade with my custom mean-reversion histogram and overlay indicator, explaining the logic behind my entires and profit-taking levels. This example is taken from $SPY on the 1-minute chart, and I examine all four of the alerts that the indicator gave today. Comment below with any questions!

Heiken Ashi Algo and the Mass Effect Moving Average: Almost HereWell ladies and gentlemen I think I have created a monster and I'm really happy to call it the heiken Ashi algo and the Mass Effect moving average combination.
Don't worry I have not been leaving you hanging. It's just been very busy and I want to make sure that this thing works beautifully for you.
So what is the heiken Ashi algo oscillator?
it is an oscillator much like the original heikin-ashi RSI with a ton more features.
As you know a little while ago I came out with the CoffeeShop Crypto HARSI, Update to the original HARSI.
And as development on that oscillator continued I had to change the name to the algo because now the oscillator actually speaks to you while trading is taking place.
But as you know you should never use a single indicator by itself to enter and exit trades and understand what's happening on your chart. you should always use something as a secondary Confluence or even a tertiary confluence. Because the more confluences you have the better right?
So with that I continued development on the Mass Effect moving average and you can use them beautifully in combination.
In this video I don't want to get into the technical Aspect of all the details on how the oscillator and the moving average work but I do want to show you the parts that have been developed and what they mean.
feel free to leave your suggestions below and I will make adjustments if needed.
I'm probably going to need one more week before fully releasing both of these together and until then I'd love to communicate with you on anything to make it more fluid.
With that let's take a look at my chart and see the breakdown.
The Heiken Ashi Algo
Double Stochastic - Uses a mean regression calculation for pullback notifications but it also adds support to knowing when a trend is in full swing.
This happens when you see both stochastic ribbons touch each other while they are the same color
Green touching green is a move to the upside. It matters most When it's above or below the 50 level.
the other thing you can see here is when they touch and when they touch again as the same color is a clear sign of a Divergence.
IBXL - Inside Bar Calculation. This will be moved to the Mass Effect MA as well
Resistance / Support / are dynamic levels which change over time
Bull Key level - Are Significant price or Price action levels which almost never change over longer periods of time. when I get a key level alert I Market on my chart with a thick line and I lock it in place. These are the major areas of supply and demand Zone on your chart and you want to watch them closely when price gets near these levels
Pull Back - Helps you draw out targets to your trend lines.
Now let's talk real quick about the mass effect moving average and what it will include.
this uses a mean regression strategy so that you can swing trade- And get your confluences of when prices going to move up or down so doesn't matter if you are in an uptrend or a downtrend .
Stop lost Trend color - Is this really a stop loss line which will follow your price action and depending on its color will tell you if you should be using a stop loss of a guy or a stop loss of a sell. Obviously if it's red you should be selling and if it's green you should be buying. do not use it incorrectly. Just because it changes to Green doesn't mean you by and just because it changes to Red doesn't mean you cell. It only means you are in an area where you should be buying or selling.
The EMA's - it includes four different exponential moving averages which you can set appropriately to your style.
The VWAP - Included in this is a VWAP Moving average. Even though the VWAP is used as a moving average against the RSI in the oscillator below, I included the VWAP in the Mass Effect moving average because once you switch to a daily chart The VWAP in the oscillator disappears but you can still have it on your chart in the Mass Effect moving average. So switching to a daily chart you will still be able to see your VWAP.
The V-CROSS - This indication shows up so that you can see when the V WAP is crossing over your price level. This helps you know from point to point if you are above or below a support or resistance level and where is your price in relation to your VWAP. This will also help you notice when price is overbought or oversold.
Fractals - Show you pivot points in market structure. I use them to find exit points for trades when there is no immediate swing low or high to be seen. Usually i look further left and use one of these points to exit. But they have even more application which I'll get into in another video.
The Trend Ribbon - Is a bullish and or bearish colored ribbon to show you the trend that works in Confluence with your stop loss line which also changes from red to Green. when they are both the same color you are in a trend in that direction of up or down. The good thing about the trend ribbon is it's always seeking the same level as the VWAP and when it finally catches up to it that's when the trend usually goes flat and then reverses.

US30 Mean Reversion TradeThis is a daily chart of the #US30 taken this morning. It's important to note that today ties the longest run of the year without the daily bar testing the 20 day moving average.
Back in August, it ran away for 24 days, ultimately to come down aggressively on that day to touch/retest the average. Today, we're extended yet again by 24 days and traders are aware that a mean reversion is imminent.
Be mindful of this in your trading right now. No one can predict when the move down will happen, but it will. It's 1000 points away so expect some big moves.
I anticipate a trend from the open any day now, if not today.

$COST Short Idea - First target 465Market has been rallying but today seemed suspect and pop in VIX implies smart money possibly hedging under the hood.
Time to start looking for hedges / short opportunities , whether we get a large move down or just a pullback before going higher, IMO in the near term we see some selling.
Costco is at trend line resistance and therefore I see it as a good hedge/ short candidate. Also at the top of the BB , implying as a mean reversion trade we at least see 495, with 465 being the max profit taking level for me.
For the less risk adverse can trade a 525/530 call credit spread or a 525/520 put debit spread, although all out short / long put is also an option ... I'm looking at DEC opex.
Cheers - Frisco

TSM weekly bottom of MRC stop loss $0TSM weekly bottom of MRC stop loss $0 stock is under political pressure, but I feel it's gonna be doing fine in a long term.

NIO daily bullish end of wave 5 C bottom of MRC Order BUY NIO NYSE Stop 10.19 LMT 10.19 will be automatically canceled at 20230401 01:00:00 EST
NIO daily bullish end of wave 5 C bottom of MRC. That may be it for NIO.

C weekly bullish hammer at MRC bottomBuy Stop 45.08 LMT 45.08 GTC
Sell Limit 56.40 GTC
Sell Stop 35.62 GTC
C weekly bullish hammer at MRC bottom ABC correction seems complete expect at least retracement for wave 4 downtrend or maybe reversal.

TLT weekly end of the ABC correctionBuy shares of TLT Stop at $97.02
TLT weekly end of the ABC correction at the bottom of the Mean Reverse Channel

Clearfield, Inc. Growing.Fundamental (reason why I am putting this stock in my watchlist): Their EPS growth and Revenue Grotwh (between Q3 2021 to Q3 is 109% and 84% respectively. ROE is 33%. This is what I define as a potential growth stocks.
Technical : It is correcting after its 6 day rally. It will be interesting if it reverts back to the mean (50,100 and 200 EMA). it is testing the 20EMA right now.
Action : Wait and see if it goes to the mean and/or form a flat tight base.

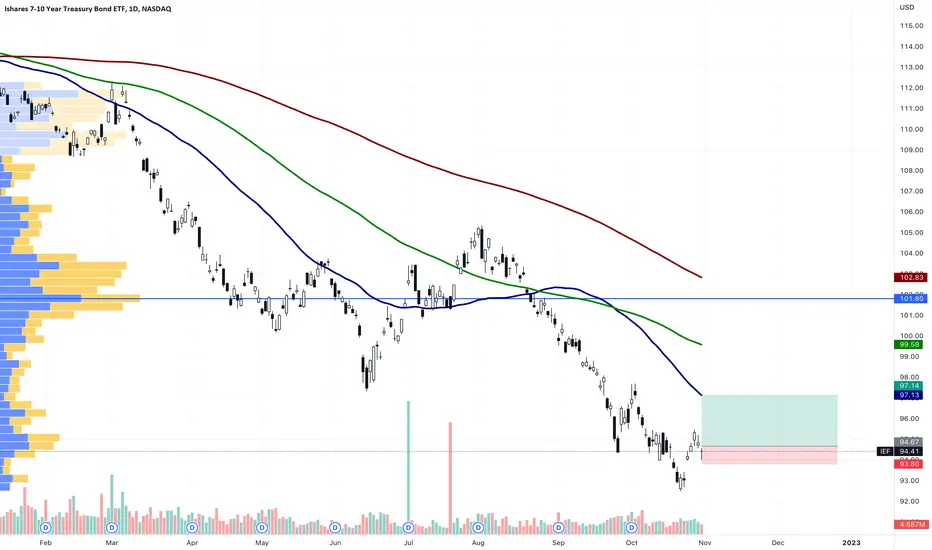
IEF daily hammer wave 3 of wave 1 uptrendOrder BUY IEF NASDAQ.NMS Stop 94.67 LMT 94.67 will be automatically canceled at 20230401 01:00:00 EST
IEF daily hammer wave 3 of wave 1 uptrend ABC correction is complete at the bottom of mean reversal channel
SHOP weekly below mean at despair zone of the bubble cycleBuy below $35
Sell Shares of SHOP with a Limit Order (Good 'til Canceled) at $197.87.
SHOP weekly below mean at despair zone of the bubble cycle HODL stop loss $0

GBPUSD have bottomed?Has GBPUSD bottomed? Price action suggest that it has. Since GBPUSD dropped to $1.036, higher lows pattern have formed WITH contracting pattern (tightening). From that pattern I drew a trendline.
Price broke the key moving averages confluenced with the trendline break. Currently price is retracing back to its mean 50/100/200 after testing several times the $1.163 level.
Actionable plan : wait for the price to test the key moving averages (keep it simple) and identify a rejection at those level and then Long.
*Rejection could be anything. but preferably confluenced with pocket pivot (blue bar or green bar at volume indicator)

META 2D exhaustion volume wave 3 wave C correctionOrder BUY META NASDAQ.NMS Stop 103.91 LMT 103.91 will be automatically canceled at 20230401 01:00:00 EST
META 2D exhaustion volume wave 3 wave C correction. Also, in despair phase of the bubble below mean on ALL timeframes.

VZ bullish hammer at the bottom of Mean Reversion ChannelOrder BUY VZ NYSE Stop 35.82 LMT 35.82 will be automatically canceled at 20230401 01:00:00 EST
VZ bullish hammer at the bottom of Mean Reversion Channel beautiful volume, weekly chart confluence, not much in our way all the way up to MA 100 except for local trend.
Stop loss below buying zone of support conservative, take profit at MA 100. 1.56R

Range bound Nikkei, Bullish mean revThe range bound Nikkei is rebounding off support at 25,750 and heading back to the mean at 27,875 and possibly to the resistance at 30,000. The last pivot low has created bullish hidden divergence which could mean the Nikkei breaks out of its range and rallies higher.


Oil Futures - Buy High, Sell HigherLooking back across the weekly chart, there has been a change in momentum.
Price action is taking out previous weekly highs.
On an intraday chart, we're currently waiting to see if there can be another close above a weekly high?

Triple divergence of the weekly RSI on US Dollar Index Triple divergence of the weekly RSO in the US Dollar Index ahead of the US CPI and the FOMC points to a significant loss of upside momentum, we would allow for the possibility for the market to mean revert to its 20-week ma at 105.76.
Disclaimer:
The information posted on Trading View is for informative purposes and is not intended to constitute advice in any form, including but not limited to investment, accounting, tax, legal or regulatory advice. The information therefore has no regard to the specific investment objectives, financial situation or particular needs of any specific recipient. Opinions expressed are our current opinions as of the date appearing on Trading View only. All illustrations, forecasts or hypothetical data are for illustrative purposes only. The Society of Technical Analysts Ltd does not make representation that the information provided is appropriate for use in all jurisdictions or by all Investors or other potential Investors. Parties are therefore responsible for compliance with applicable local laws and regulations. The Society of Technical Analysts will not be held liable for any loss or damage resulting directly or indirectly from the use of any information on this site.

So Long and Thanks for all the FishI wasn’t able to do much charting and analysis this week.
I'm taking a step back from charting the next few weeks as I finish a project.
I wanted to get this last chart out that I have been working on for historical look at the vix.
Why is the VIX so important?
I would argue that the VIX is the most important indicator in a speculators arsenal.
The vix is important because after a volatility event the vix will do what it does.
Revert to Mean.
To see this phenomenon in action all you have to do is a regression trend of VIX from ~2003 to pre-march 2020 to find the mean for VIX is 15.39
Next add another regression trend line sine the Covid 19 Spike and you will see that it took Oct 25 for the VIX event mean return to historical mean.
So a speculator like me can conclude that the Crash of 2020 has completed its mean reversion.
What was the cost you ask?
To determine that, just extend the regression trend to now to find the current mean and WHAT THE HELL!
A trend line formed from the completion of the mean reversion for covid to today and we see that the VIX Mean overall has now risin to 19.70.
This is huge as a speculator because it gives us a variable to use in our analysis and some assumptions we can make to predicting a trend after an event.
1. When a crisis occurs, the government will step in to correct it with QE in some form.
2. After a large volatility event or even a bear market selloff, we can estimate an amount and time to reversion.
Everyone has questioned why the Fed kept the peddle to the QE meddle.
Well now you know why, to give the markets time to revert to mean.
The bigger the spike, the more QE and/or time it will take to revert to mean.
OK Then. Can the VIX predict a crash?
I think it can and already is pointing to a near term event.
If you compare the 08 GFC you will see 1 important trend of VIX since Jan 07 is a steady increase in volatility until the market eventually crashed.
Unlike the March 2020 event which was spontaneous pop in VIX.
Now you see, since mean reversion completed in Oct 25th, a steady increase in overall market volatility has taken hold.
While the market still mean reverts after a bear leg selloff, that overall mean continues to rise.
So How long before it pops?
While 07-08 rise in volatility prior to its crash gives us some indication an event is imminent, it won’t be the same.
I suspect it will be sooner and larger than anyone expects.
If you look at 07-08s incline, It indicates we are knocking at the doorstep.
It’s why I think VXX stopped issuing in March.
It’s why we get such crazy market rallies in the middle of a “recession” and inverted yields.
Everyone knows there is something wrong, the FED is waving their arms in the air like they just don't care.
OK smart ass, then why won’t the markets crash.
It’s because capital markets of today are much more reflexive than they were in the past.
Since 2018, options began increasing in volume and popularity.
Now, the dealers that sell those options, aka house the risk (or lack of risk) need to dynamically hedge their delta.
When 1 dealer is offside from dealer 2, you can expect they will continuously hedge back and forth until….
They reach mean.
This isn’t an overnight process and takes about 21 days in my estimation and is the VANNA and CHARM effects so prevalent in the markets over the past 2 years.
It’s why there were such predicable dips every 19th during 2021.
It’s why we got a huge bear rally this summer. (Volatility Compression).
It’s why every golden cross has a death cross.
It’s why moving averages provide hints to direction.
OK, OK. This makes sense.
But Why?
Massive amounts of Delta hedging.
I broke down one of the largest hedges wrapped around todays market equities and mapped out the strategies Delta graph.
Delta is simple to understand and once you can visualize negative and positive delta you can extrapolate the zones of volatility.
Once you map those zones to changes in volatility you have a good base to start marking assumptions.
VIX Log Returns moving average.
In the bottom panel I created a log return moving average that can give you a magnitude of movements.
Ranked from 0-10 in increased volatility you can see that covid 19 moved the volatility scale the most in history with a 9.0 in the VIXTER SCALE.
This scale can also move negative to -5
For each spike high there is always an equal push negative to bring volatility back to mean.
With all this knowledge we can form a picture in our mind of a trampoline.
The tension (or reflexivity) in the trampoline are the dealers pulling liquidity to their side. This includes all the hedge funds, market makers, bulls, bears, prop traders, theta gang, tsla gang, retail, institutions, etc are all pulling the trampoline tighter to their side.
Each economical decision or crisis is going to launch VIX that much higher.
That is until the trampoline breaks under the pressure.
The FED saved banks and corporations after Covid with Stimulus, not the checks you got in the mail (those take time to trickle down to corporations), but the debt they were buying and adding to their balance sheet.
That is a massive 9 Trillion dollars.
That gave our trampoline the added support it needed to recover.
What happens now when the FED puts that 9 Trillion in assets back into the market.
The tension grows until the next crisis or event launches it to 10.
Then it's...
So long and thanks for all the Fish.

Mean reversion buy on earnings crash of $LRN $LRN has been trading in a bullish channel for over a year now, and now is retesting the lower end of the channel's support. I'm entering a long position as the previous two candles were a doji and inverted hammer, both being strong signs of reversal. Additionally, at open, the stock gapped down below the lows on both the previous two candles, giving a good risk/reward ratio for this trade. I'm aiming to sell when the price crosses back to the moving average 50, for a small swing, but will cut my losses if the price falls below ~33.17, around where the previous trough's low was.

Nifty Price action analysis based on Bollinger band This analysis is an attempt at using a simple Bollinger Band tool to work out the probability of price action
in the coming week.
Do comment on the analysis. In my view keeping trading simple is the key to consistent success.
Sometimes making it complex gives the wrong or confusing signals.
